This page contains affiliate links. Learn more.
Our Verdict (Best For)
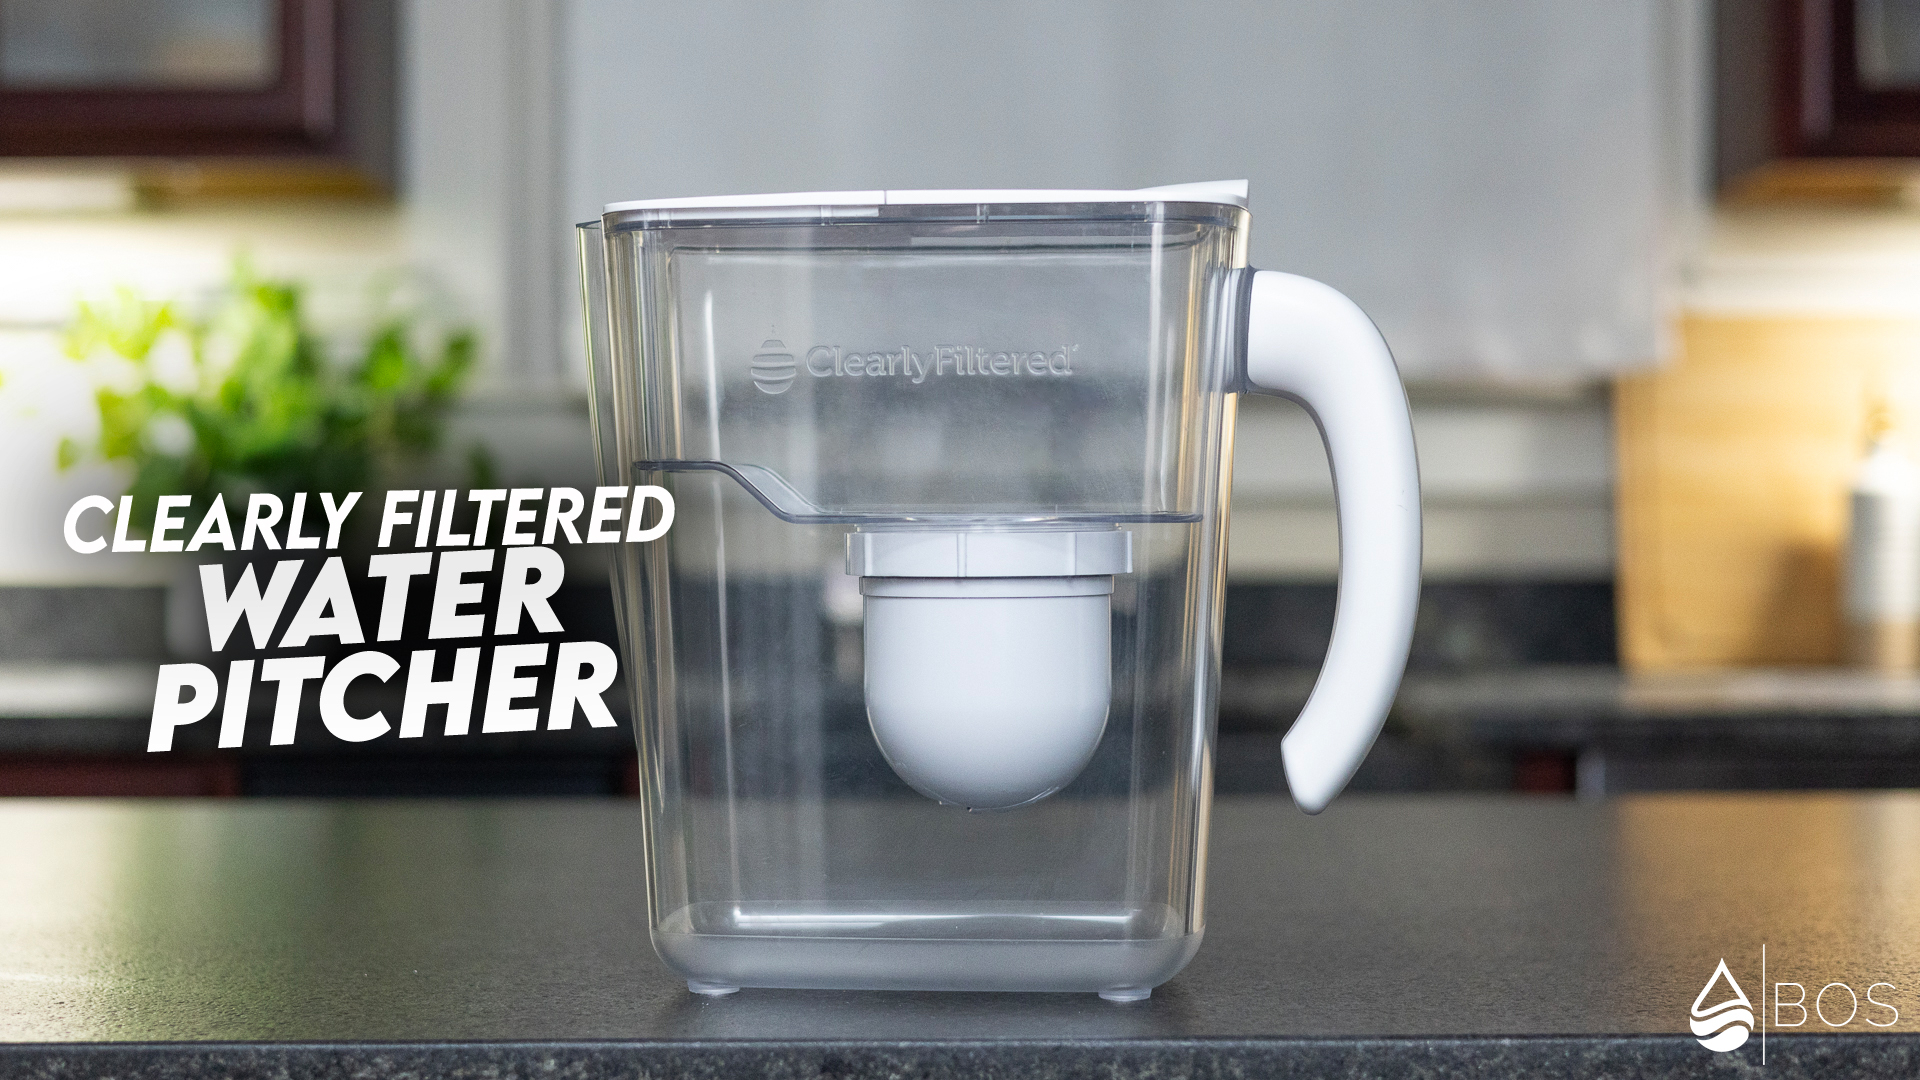
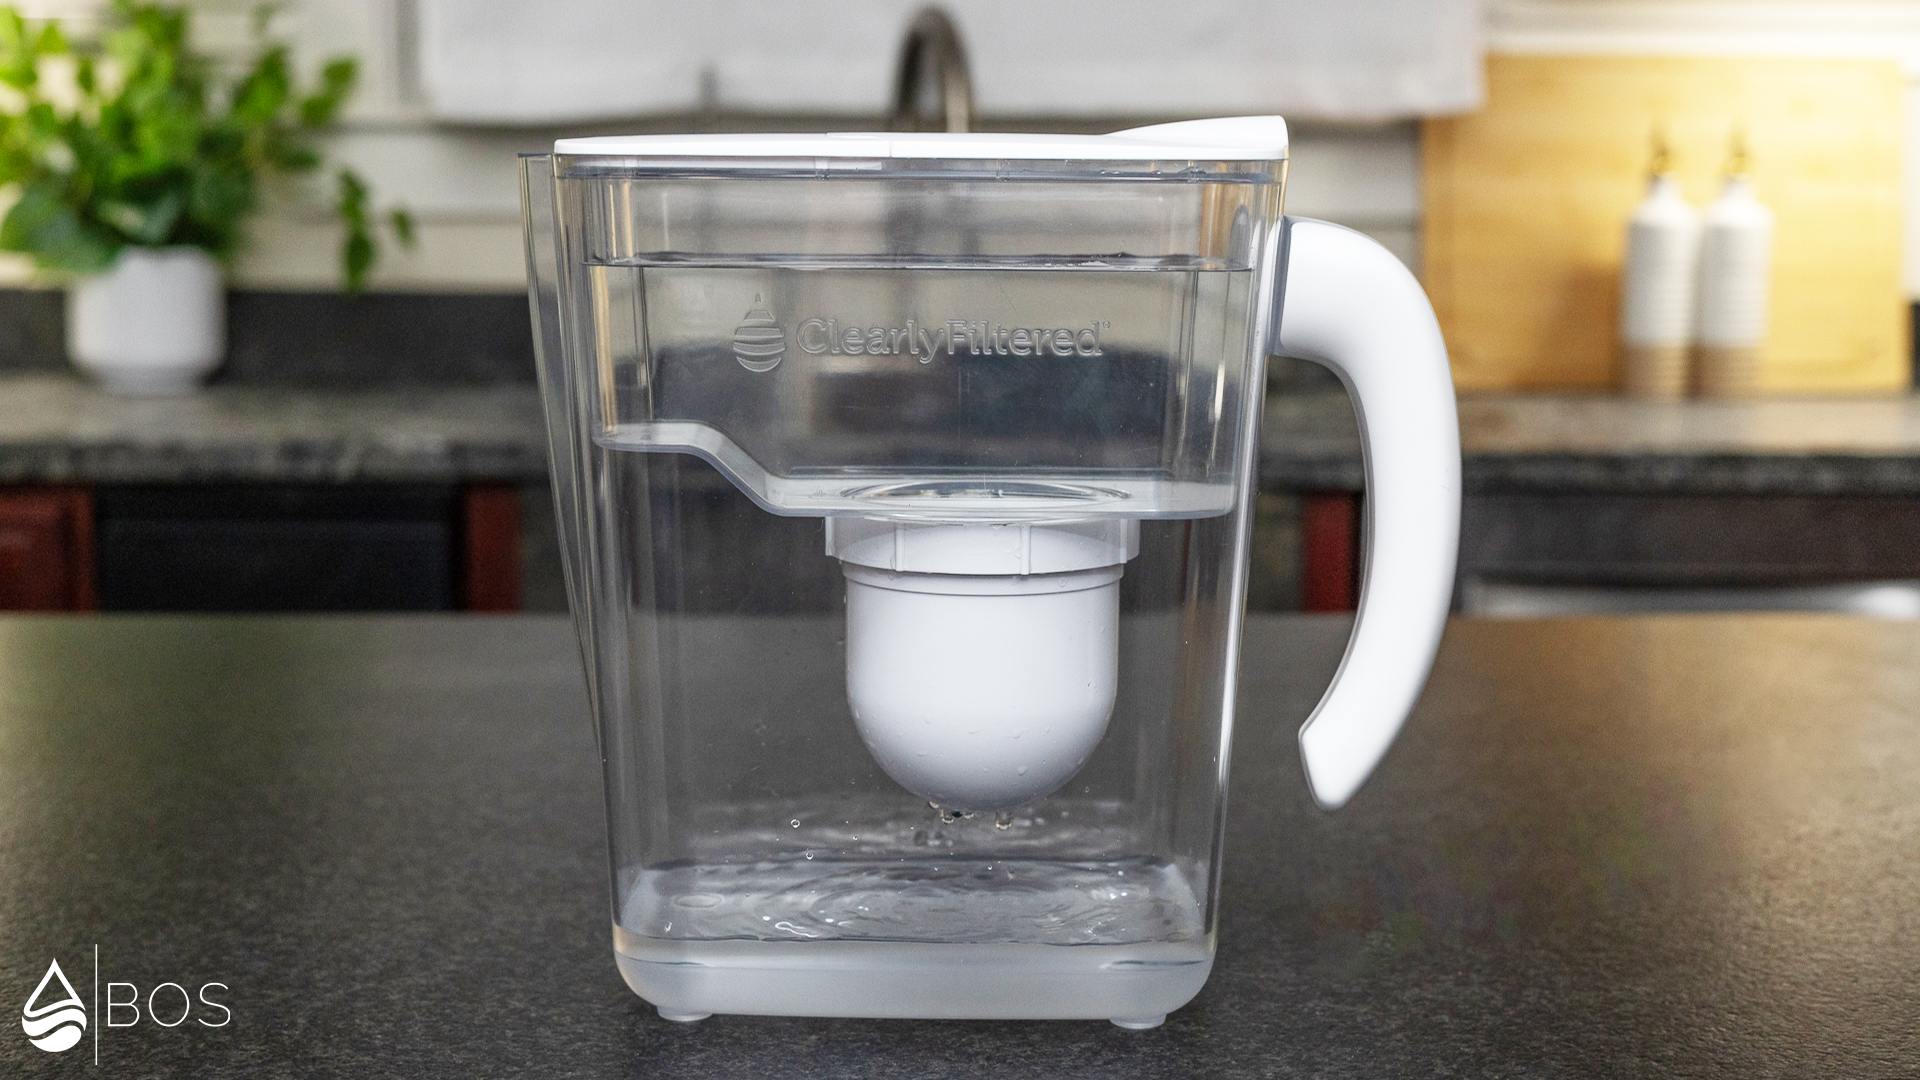
The Clearly Filtered is our #1 water filter pitcher, offering the most effective filtration and being the best all-rounder. In our lab tests, it removed most contaminants and delivered clean-tasting (2024) or much improved from tap water (2025). It only has 2 NSF/ANSI certifications but is backed by comprehensive 3rd-party testing to 200% filter life. It’s made from medical-grade Tritan with a large comfortable handle and a flip-top for easy refilling. Setup and maintenance are a breeze, too. The pitcher is fast enough for daily use with large feed and filtered capacities (still fits the fridge) requiring fewer refills, but on-demand filtering takes patience. Also, expect splashing if pouring too quickly. Warranty? 2 years – well above average, which also applies to upfront and annual filter cost.
The Clearly Filtered Water Pitcher is designed for use as a drinking water filter and can purify both tap water and properly disinfected well water.
As usual, we’ve tested the pitcher with our own hands:
- Hands-on experience: We assembled, primed, used, and maintained it.
- Filtration effectiveness: Across 2 independent test rounds, we sent unfiltered and filtered tap water samples to professional laboratories for analysis to determine real-world contaminant reduction. Each round used a different pitcher, water supply, and lab. We also reviewed NSF/ANSI certifications and other available test data.
- More testing: We conducted taste and odor evaluations as well as filtration speed tests.
- All other product aspects: We considered initial and long-term costs, warranties, additional features, frequent customer complaints, and more.
To learn more about our testing procedure check our editorial guidelines.
Contents

Final Rating: /5.00
FiltrationFiltration score combines our lab results and taste testing with NSF/ANSI certifications and 3rd-party contaminant reduction data.: /5.00
Usability: /5.00
CostsCost scores reflect overall value for money rather than price alone.: /5.00
| Type: | Water Filter Pitcher |
| PriceNo short-term sales. (Sep 16, 2025): | $100 (Use Code BOS10 for 10% Off; Save Additional 10% With Filter Subscription) |
| Yearly CostEstimate is based on rated/claimed filter life and 300 gallons annual water consumption. No short-term sales. (Sep 16, 2025): | ~$155 (Save 10% With Filter Subscription) |
(Use Code BOS10 for 10% Off!)
Final Rating: /5.00
What We Like Most
- Achieved solid results in our 2024 and excellent results in our 2025 lab testing.
- Filtered water tasted perfectly clean with no odor (2024 test). Filtered water had a much better taste and no odor (2025 test).
- Pretty much fully covered by third-party testing for contaminant reduction to 200% filter Life.
- Medical-grade Tritan plastic build with a large, comfortably fitting handle, free from BPA, BPS, phthalates and estrogen & androgen activity (according to Clearly Filtered).
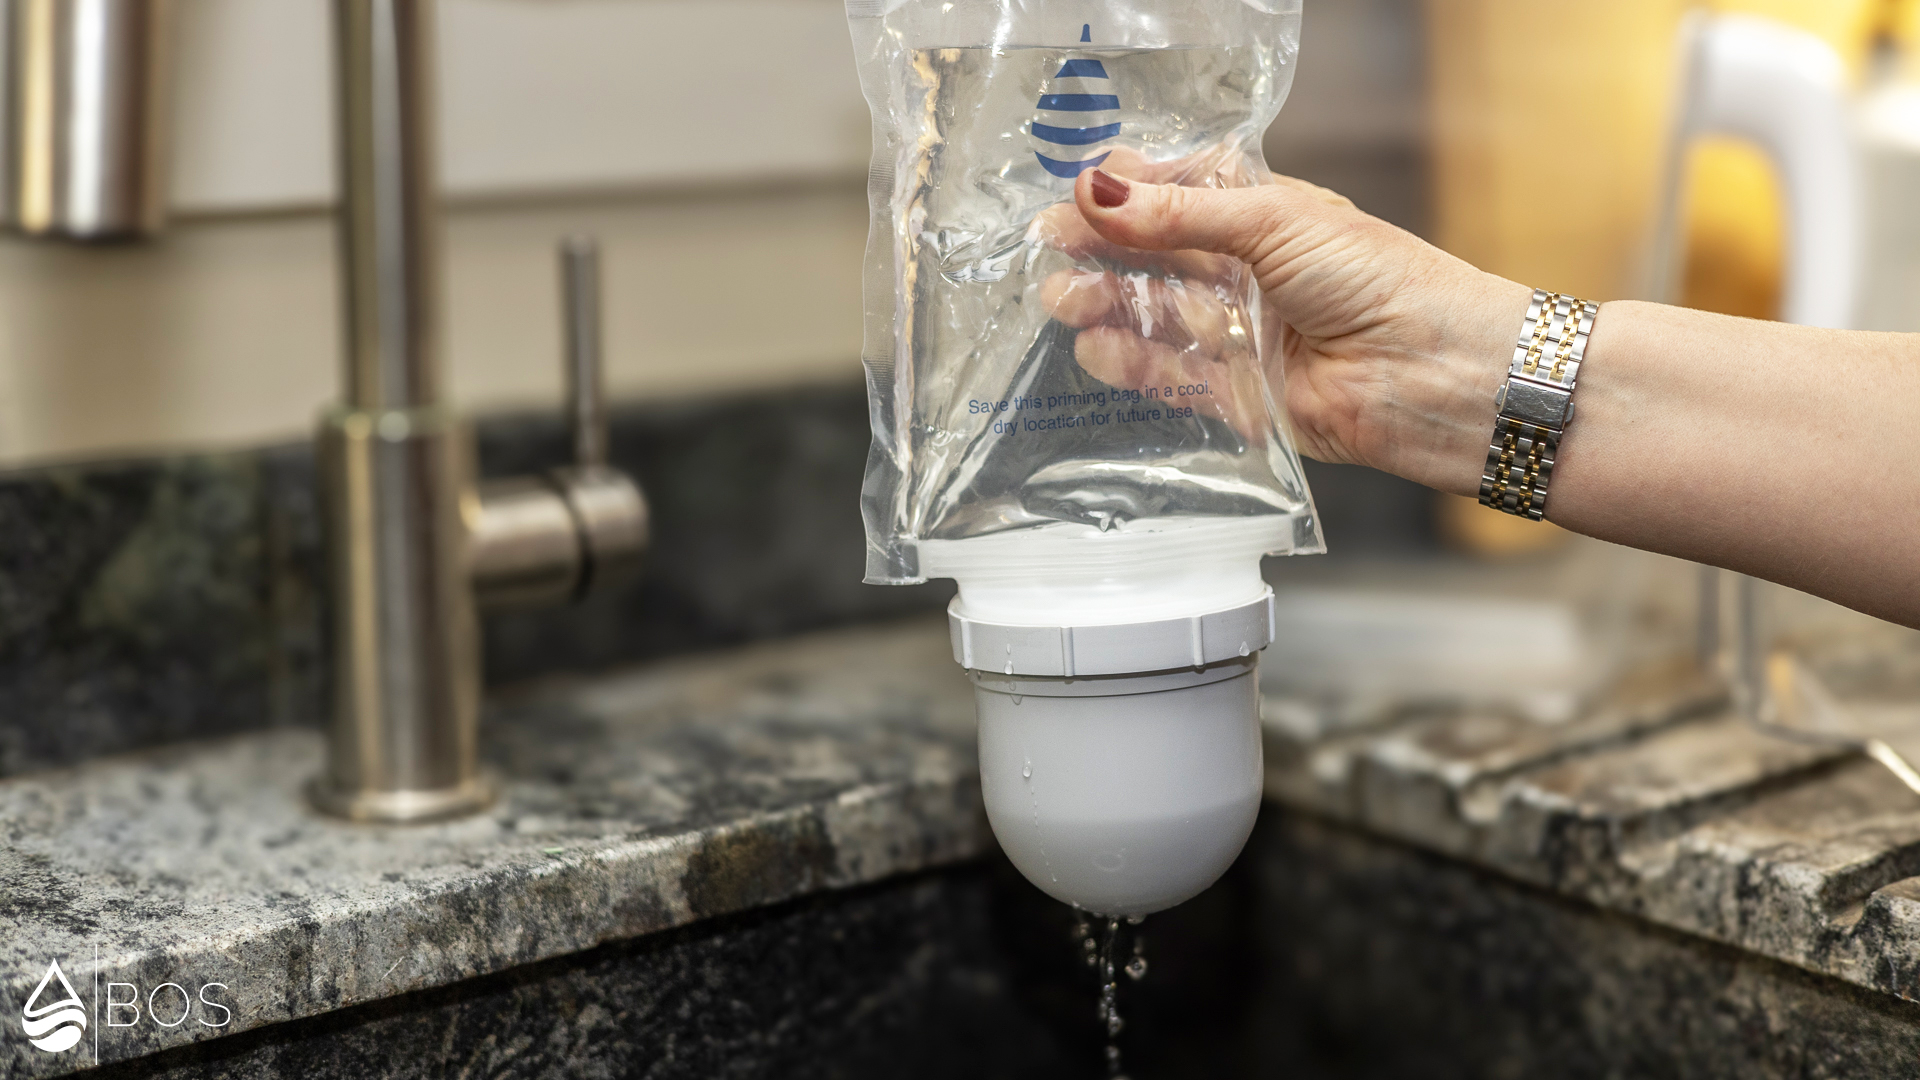
- Easy to set up with clear, illustrated instructions, a QR code-linked tutorial video, and a priming bag that makes it easy for water to be pushed through the filter cartridge, reducing waiting time.
- Fast enough for daily use with a large feed and filtered water capacity, requiring fewer refills.
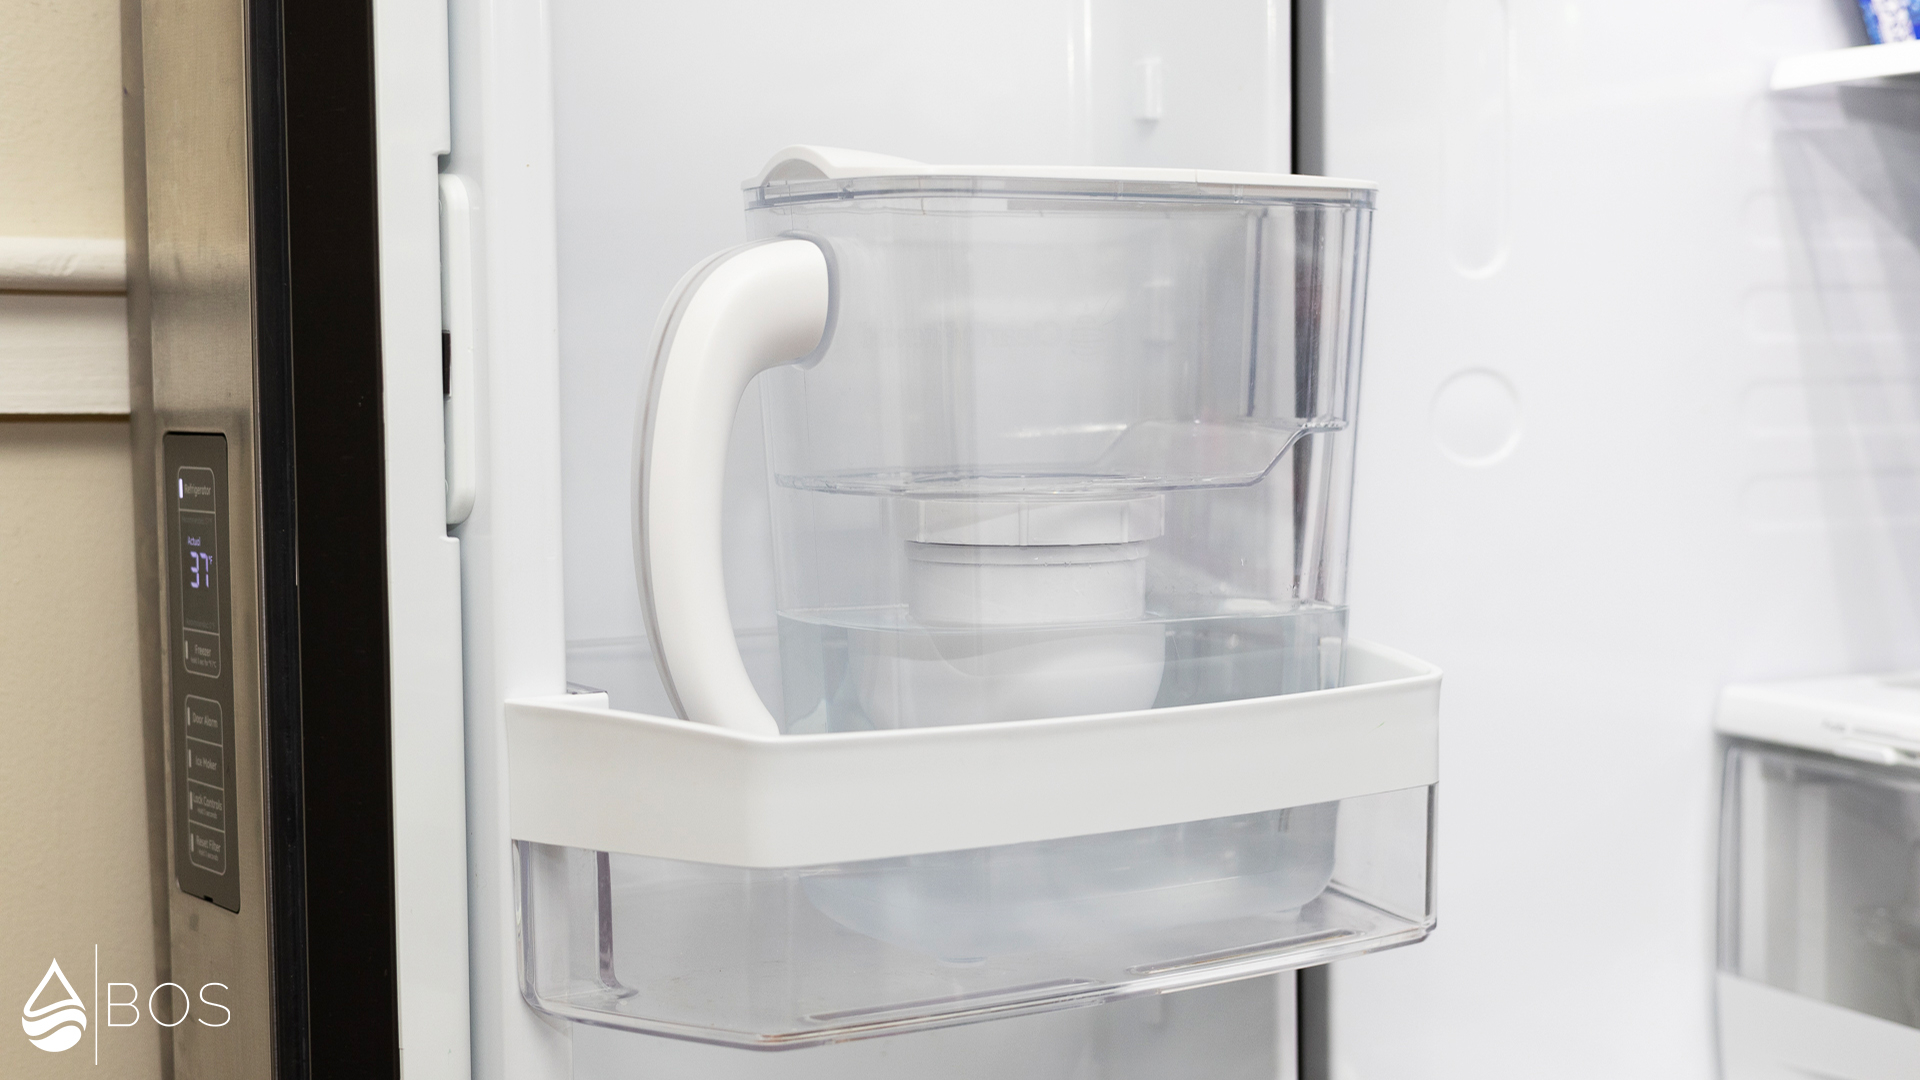
- Large enough to fill a 40-oz bottle with a single refill while fitting comfortably in fridge shelves and doors.
- Easy to refill thanks to its wide-opening flip-top with a clear upper reservoir indicating how much water remains to be filtered.
- Filters are easy to replace, with a long 100-gallon filter life.
- Backed by a 2-year warranty.
What We Don’t Like
- Only 2 actual NSF/ANSI certifications (chlorine + taste/odor reduction).
- On-demand filtering takes patience.
- Splashes in a wide pattern if poured too quickly, and if the pitcher is tilted too steeply, unfiltered water may escape from the flip-top lid.
- No filter life indicator.
- Well above-average upfront + estimated annual filter replacement cost.
- Third-party customer complaints include clogged filters leading to slow flow, reservoir and lid instability, heaviness or bulkiness, and pouring issues.
How the Clearly Filtered Water Pitcher Compares to…
13 Other Water Filter Pitchers
In this video, Sara explains why the Clearly Filtered became our #1 overall water filter pitcher.
Please note: Our full guide on the best water filter pitchers is available here.
Video Chapters + Comparison Sheet
- Link to Comparison Sheet
- 00:00 – Intro
- 00:33 – What’s New
- 01:10 – Our 14 Pitchers
- 03:00 – Top Pick: Clearly Filtered
- 12:21 – Runner-Up: Culligan (and ZeroWater)
- 23:20 – For Usability: Epic Pure
- 26:22 – Budget Pick: Brita Everyday Elite
- 28:07 – Hard Water: Waterdrop Chubby
- 28:57 – Bacteria & Parasites: LifeStraw
- 30:16 – Seychelle RAD & Aquagear
- 32:03 – LARQ Pitcher PureVis
- 33:35 – PUR Plus 11-Cup
- 35:09 – Summary
Full Analysis of the Clearly Filtered Water Pitcher
Filtration: /5.00
The Clearly Filtered Water Pitcher scored 4.50/5.00 for filtration. How? It achieved solid results in our 2024 lab testing and had an even better performance in 2025, yielding excellent results. In our 2025 test, the filtered water had a much better taste than our tap water while in 2024, we enjoyed a clean taste. (No odor was noted in either test round). Finally, while the pitcher has only two NSF/ANSI certifications for contaminant reduction, it is pretty much fully covered by third-party testing to 200% filter life.
1. Lab Results: /5.00 (2025) & /5.00 (2024)
Remember that our before vs after lab comparison is not an exact science. It’s informational and subject to variability, inaccuracies, and interferences caused by natural fluctuations in water quality, accidental contamination, human error, instrumentation issues, and more. Furthermore, our lab-testing is limited to those contaminants present in our water supplies and at their respective concentrations. As such, it can only give us a general idea for how effective a certain water treatment product might be.
In our 2024** and 2025 lab tests comparing an unfiltered and a filtered tap water sample, the Clearly Filtered pitcher could remove 12 undesirable impurities and contaminants to below the minimum detection level (so essentially to 100%): chlorine, bromodichloromethane*, bromoform, dibromochloromethane*, chloroform*, copper, barium, lithium, strontium, iron, manganese, and uranium.
The following substances remained in our water:
- Boron – showed a very poor 14% reduction in 2024 but was completely removed in 2025. The apparent discrepancy might have to do with our initial issues priming the filter cartridge in our 2024 testing which produced unusual lab results and caused us to repeat the lab tests with 2 additional filters. The same rationale may also apply to other contaminants for which our 2024 and 2025 lab results differ substantially, including cases of potential leaching.
- Nitrate was only reduced by 6% in 2024, which again is very poor, but was removed by a very high 96% in 2025. While our 2024 lab findings seem to challenge the Clearly Filtered’s third-party test data which claims the reduction of nitrate by >99.96%, our 2025 results were much more comparable. Aside from our priming issues, the apparent discrepancy with our 2024 results may also partly be explained by differing test conditions – the Clearly Filtered’s feed water had a ~17.5x greater concentration of nitrate (27 ppm) compared to our feed water. Again, the same rationale may also apply to other contaminants for which our observed reduction rates differ substantially from those reported by the manufacturer, including cases of potential leaching.
- Fluoride increased by 184% in 2024. However, it’s unlikely that the Clearly Filtered pitcher adds fluoride to the water. For one, there’s no fluoride-based filter media. Such a large increase is also unlikely to be the result of natural fluctuations. That said, our 2024 fluoride test method is known to be susceptible to alkalinity interference, with higher alkalinity producing artificially elevated fluoride readings. Because the filtered water showed increased alkalinity, it’s possible that this apparent fluoride increase is not real. In our 2025 testing, where we used a different lab method to measure fluoride (one which we consider to be much more reliable compared to 2024), the Clearly Filtered completely removed all fluoride from the water. This later result is compatible with the Clearly Filtered’s third-party test data which claims >99.54% fluoride removal.
Finally, limescale/hardness decreased by 95% in 2024 and by 55% in 2025. Given this range, the Clearly Filtered pitcher could help protect your kettle and/or coffee maker from limescale buildup.
Aside from contaminant reduction, we found 2 substances in our 2024 filtered water that were not present in the unfiltered water, suggesting potential leaching: silver (0.033 ppm) and titanium (0.07 ppm). Titanium also showed up in our 2025 filtered water (0.00205 ppm), and a third contaminant, cobalt, was also detected (0.0012 ppm).
Silver was found at a 3x lower level than the strictest silver heath guideline at 0.1 ppm. While excess silver does not pose any health risk, elevated levels can still cause undesirable cosmetic effects (skin discoloration and graying of the whites of the eyes). We couldn’t find any health guideline for titanium in drinking water; the lack of a guideline suggests it shouldn’t be a health concern. While cobalt is more worrisome given its adverse effects on the heart and other organs, it was found in our filtered water at a much lower level (58.3x) than the strictest cobalt health guideline of 0.07 ppm. The detection of silver and cobalt in the filtered water also contradicts Clearly Filtered’s third-party test data which reports >99.02% and >98.31% reduction, respectively, and may be subject to the same test-condition and leaching considerations discussed above.
*In our 2025 lab testing, we artificially spiked our tap water with fluoride and nitrate because our new water supply contains neither. The nitrate solution, however, unintentionally contained chloroform, resulting in a test concentration of 1,670 ppm – far above realistic tap water levels (100 ppm is already considered high). Despite this extremely elevated concentration, the Clearly Filtered pitcher removed all chloroform and other disinfection byproducts. This result is significant on its own and is also why we did not re-test VOC reduction, unlike other pitchers that failed to fully remove VOCs (including chloroform) in our ultra-high chloroform test.
**In 2024, we initially had issues priming the filter cartridge which produced unusual lab results. Consequently, we repeated the 2024 lab tests with 2 additional filters for a total of 3 filters, yielding 3 test results for each contaminant (except VOCs which we didn’t re-test). For all retested impurities in 2024, we used the average of the 3 results for our analysis.
Lab Results Charts
| Potentially Harmful | Aesthetic Issues | Feed Water Level | Filtered Water Level | Reduction Rate | |
| Water Disinfectants | |||||
| Chlorine (mg/L) | ✖ | ✖ | ~2 | 0 | 100% |
| Disinfection Byproducts (Ultra-High Chloroform) | |||||
| Bromodichloromethane (µg/L) | ✖ | 19.9 | 0 | 100% | |
| Dibromochloromethane (µg/L) | ✖ | 5.81 | 0 | 100% | |
| Chloroform (µg/L) | ✖ | 1,670 | 0 | 100% | |
| Metals | |||||
| Copper (mg/L) | ✖ | ✖ | 0.0136 | 0 | 100% |
| Iron (mg/L) | ✖ | 0.0763 | 0 | 100% | |
| Manganese (mg/L) | ✖ | ✖ | 0.0036 | 0 | 100% |
| Barium (mg/L) | ✖ | 0.0407 | 0 | 100% | |
| Boron (mg/L) | ✖ | 0.0153 | 0 | 100% | |
| Strontium (mg/L) | ✖ | 0.112 | 0 | 100% | |
| Salts | |||||
| Nitrate (N) (mg/L) | ✖ | 2.74 | 0.123 | 96% | |
| Fluoride (mg/L) | ✖ | 0.925 | 0 | 100% | |
| Aesthetic Parameters | |||||
| Hardness (mg/L) | ✖ | 59.89 | 26.71 | 55% | |
| Other Parameters | |||||
| pH | 7.8 | 8 | |||
| Impurities NOT Detected in Unfiltered Tap Water Sample | |||||
| Cobalt (mg/L) | ✖ | 0 | 0.0012 | ||
| Titanium (mg/L) | 0 | 0.00205 | |||
| Lab Reports: Filtered Water Report, Unfiltered Water Report | |||||
| Chlorine Self Test Photos: Filtered Water, Unfiltered Water | |||||
| Explanation: | |||||
| Full Removal | |||||
| Considerable Reduction | |||||
| Concentration More Than Double of Unfiltered Water Sample | |||||
| Potential Leaching Reached or Exceeded the Strictest Public Health Guideline We Could Find | |||||
| Potentially Harmful | Aesthetic Issues | Feed Water Level | Filtered Water Level | Reduction Rate | |
| Water Disinfectants | |||||
| Chlorine (mg/L) | ✖ | ✖ | 1st Round: 0.2 2nd Round: 0.15 |
1st Round: 0 2nd Round: 0 | 0 |
100% (Avg of 3) |
| Disinfection Byproducts | |||||
| Bromodichloromethane (µg/L) | ✖ | 0.58 | 0 | 100% | |
| Bromoform (µg/L) | ✖ | 0.75 | 0 | 100% | |
| Dibromochloromethane (µg/L) | ✖ | 0.94 | 0 | 100% | |
| Metals | |||||
| Copper (mg/L) | ✖ | ✖ | 1st Round: 0.01 2nd Round: 0.02 |
1st Round: 0 2nd Round: 0 | 0 |
100% (Avg of 3) |
| Barium (mg/L) | ✖ | 1st Round: 0.01 2nd Round: 0.01 |
1st Round: 0 2nd Round: 0 | 0 |
100% (Avg of 3) | |
| Boron (mg/L) | ✖ | 1st Round: 0.04 2nd Round: 0.03 |
1st Round: 0.01 2nd Round: 0.03 | 0.04 |
14% (Avg of 3) | |
| Lithium (mg/L) | ✖ | 1st Round: 0.01 2nd Round: 0.02 |
1st Round: 0 2nd Round: 0 | 0 |
100% (Avg of 3) | |
| Strontium (mg/L) | ✖ | 1st Round: 0.18 2nd Round: 0.2 |
1st Round: 0 2nd Round: 0 | 0 |
100% (Avg of 3) | |
| Salts | |||||
| Nitrate (N) (mg/L) | ✖ | 1st Round: 1.65 2nd Round: 1.42 |
1st Round: <0.5 2nd Round: 1.89 | 1.69 |
6% (Avg of 3) | |
| Fluoride (mg/L) (Flawed?) | ✖ | 1st Round: 0.46 2nd Round: 0.57 |
1st Round: 1.71 2nd Round: 1.07 | 1.67 |
184% Increase (Avg of 3) | |
| Other | |||||
| Uranium (µg/L) | ✖ | 1st Round: 7 2nd Round: 6 |
1st Round: 0 2nd Round: 0 | 0 |
100% (Avg of 3) | |
| Aesthetic Parameters | |||||
| Hardness (mg/L) | ✖ | 1st Round: 111.9 2nd Round: 113.6 |
1st Round: 4.6 2nd Round: 7.9 | 2.6 |
95% (Avg of 3) | |
| Other Parameters | |||||
| Alkalinity (mg/L) | 1st Round: 140 2nd Round: 147.5 |
1st Round: 350 2nd Round: 195 | 252.5 |
85% Increase (Avg of 3) | ||
| pH | 1st Round: 7.77 2nd Round: 8.18 |
1st Round: 6.41 2nd Round: 8.32 | 8.56 |
|||
| Impurities NOT Detected in Unfiltered Tap Water Sample | |||||
| Silver (mg/L) | ✖ | 0 | 0.03 | 0.02 | 0.05 | ||
| Titanium (mg/L) | 0 | 0.09 | 0.03 | 0.09 | |||
| Lab Reports for 1st Round of Testing (Priming Issue): Filtered Water Report, Unfiltered Water Report | |||||
| Lab Reports for 2nd Round of Testing: Filtered Water Report #1, Filtered Water Report #2, Unfiltered Water Report | |||||
| Explanation: | |||||
| Full Removal | |||||
| Considerable Reduction | |||||
| Concentration More Than Double of Unfiltered Water Sample | |||||
| Potential Leaching Reached or Exceeded the Strictest Public Health Guideline We Could Find | |||||
2. NSF/ANSI Certifications and Other Test Data
The Clearly Filtered pitcher is certified only for the reduction of 2 contaminants (chlorine and taste/odor) by the WQA against NSF/ANSI standard 42. But it has comprehensive third-party testing for the reduction of 355 contaminants to 200% filter life against NSF/ANSI standards 42, 53, 401 and other non-NSF/ANSI standards. Reported reduction rates include chlorine (>99.52%), chloramine (>99.68%), fluoride (>99.54%), heavy metals like aluminum (>99.13%), antimony (>98.00%), arsenic (98.00%), chromium 6 (99.68%), lead (99.34%), and uranium (96.67%), many herbicides (98.09-99.99%+), microplastics (>99.99%), 9 PFAS (95.00-99.50%+), dozens of pesticides (98.19-99.98%+), trace pharmaceuticals (98.40-99.99%+), radiological elements (98.00-98.04%+), semi-volatiles (98.51-99.99%+), and nearly 100 VOCs (98.49-99.99%+). Reduction rates are per the official performance data sheet.
3. Filtration Process
The Clearly Filtered cartridge contains a woven sediment filter screen, granular activated carbon and a proprietary composite layer (based on ion exchange resin).
- The woven sediment filter screen (mechanical filtration) acts like a sieve to remove solid (undissolved) particulates such as dirt or rust.
- Granular activated carbon removes things like bad tastes and odors, chlorine/chloramine, disinfection byproducts and other organics, as well as certain metals.
- Ion exchange targets dissolved, unwanted ions in the water.
4. Taste and Odor Tests
In our 2024 test, the filtered water was odorless and had a clean taste. In our 2025 test, the filtered water was odorless as well, and the taste was much improved compared to our tap water but not 100% perfect.
Usability: /5.00
The Clearly Filtered pitcher achieved a usability score of 4.10/5.00, based on its performance in the following categories:
- Initial system assembly including filter priming (1.00/1.00)
- Day-to-day use (2.50/3.10)
- Filter replacements (0.60/0.90)
1. Initial Setup: /1.00
Assembling the Clearly Filtered pitcher is easy and straightforward. In addition to clear, illustrated directions, a convenient QR code also links users to a tutorial video. Also, setup before first use begins with filter priming, which is expedited by the use of the provided priming bag that avoids the need to wait for real-time filtration.
Here’s a quick breakdown of the setup process:
- Remove the sticker covering the filter’s intake holes.
- Flip the priming bag upside down and fill it with cold water. Once the bag is full, twist the threaded base of the filter onto the priming disc of the priming bag until snug.
- Flip the priming bag right side up; holding the bag over the sink, squeeze it with both hands to force the water down through the filter. Water should drip out of the bottom of the filter – a sign that the filter is primed.
- Squeeze the bag until empty and then repeat this process 2-3 times.
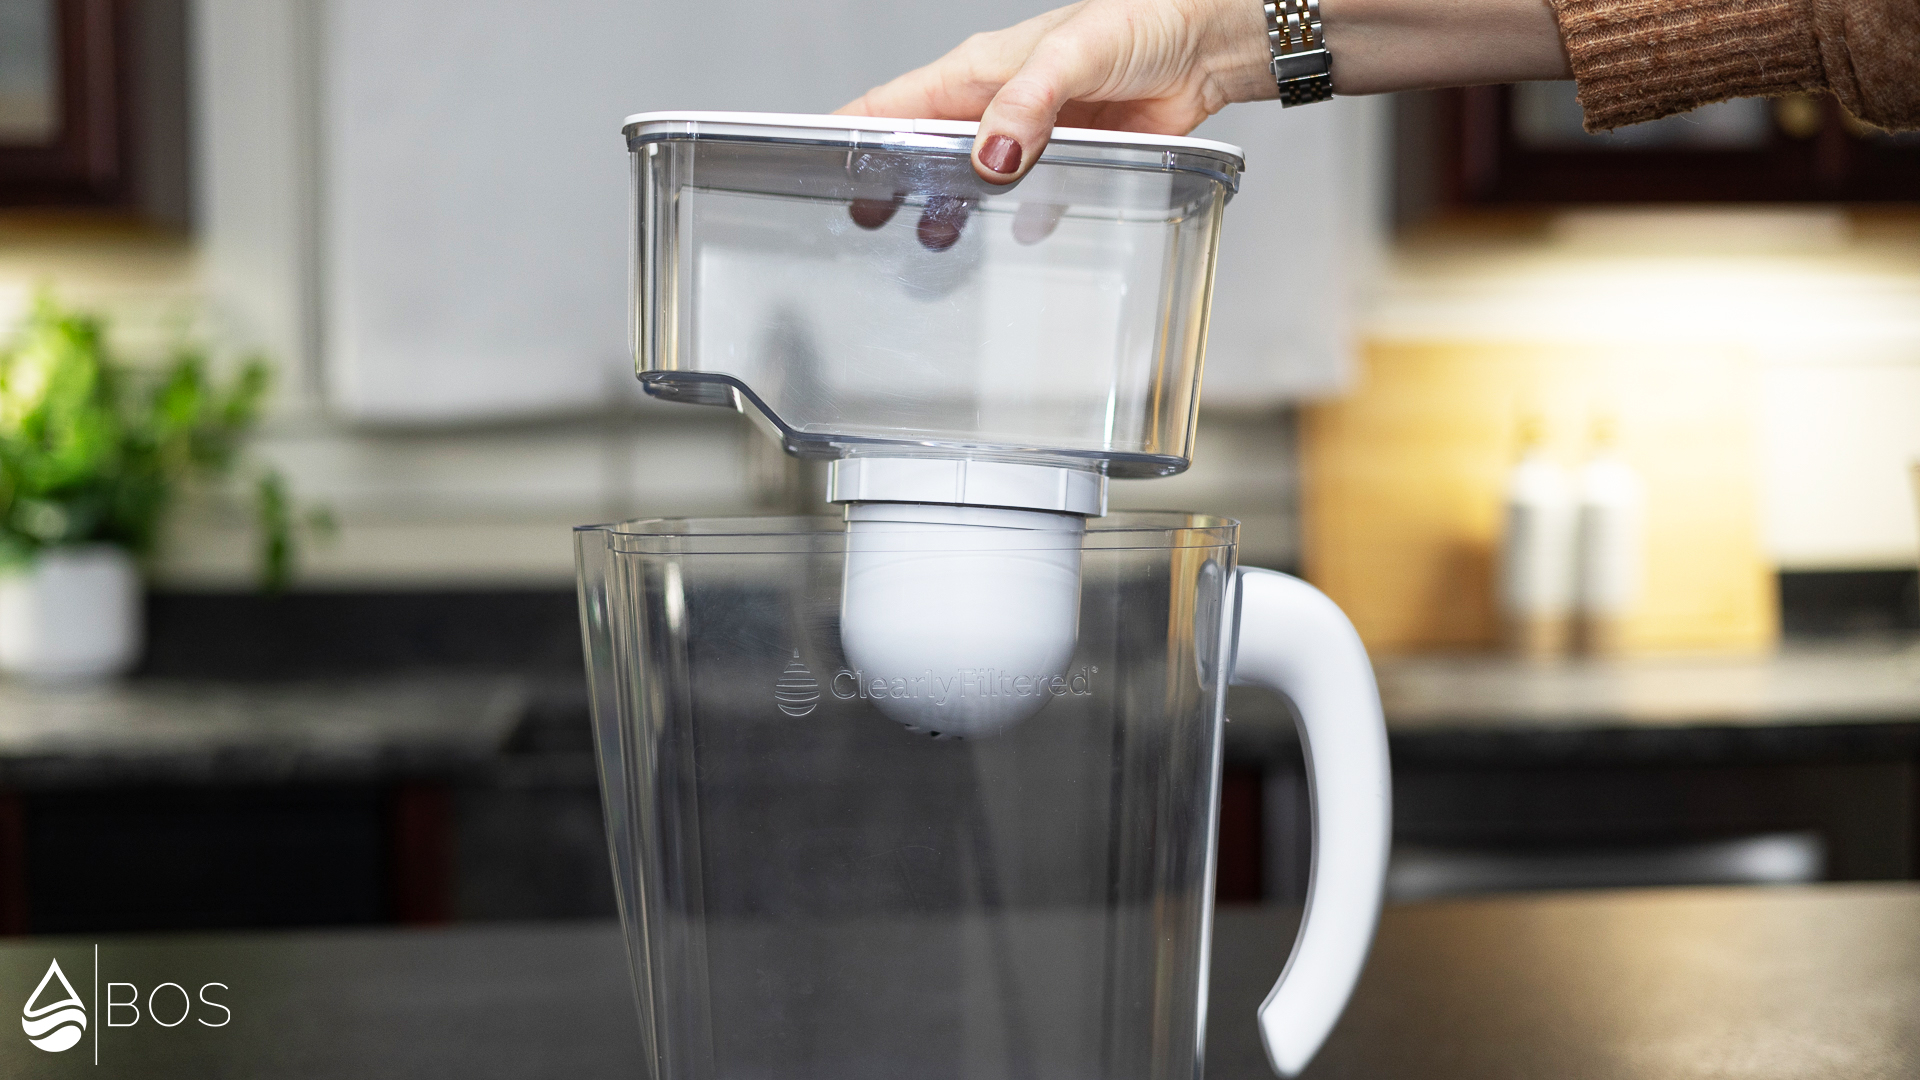
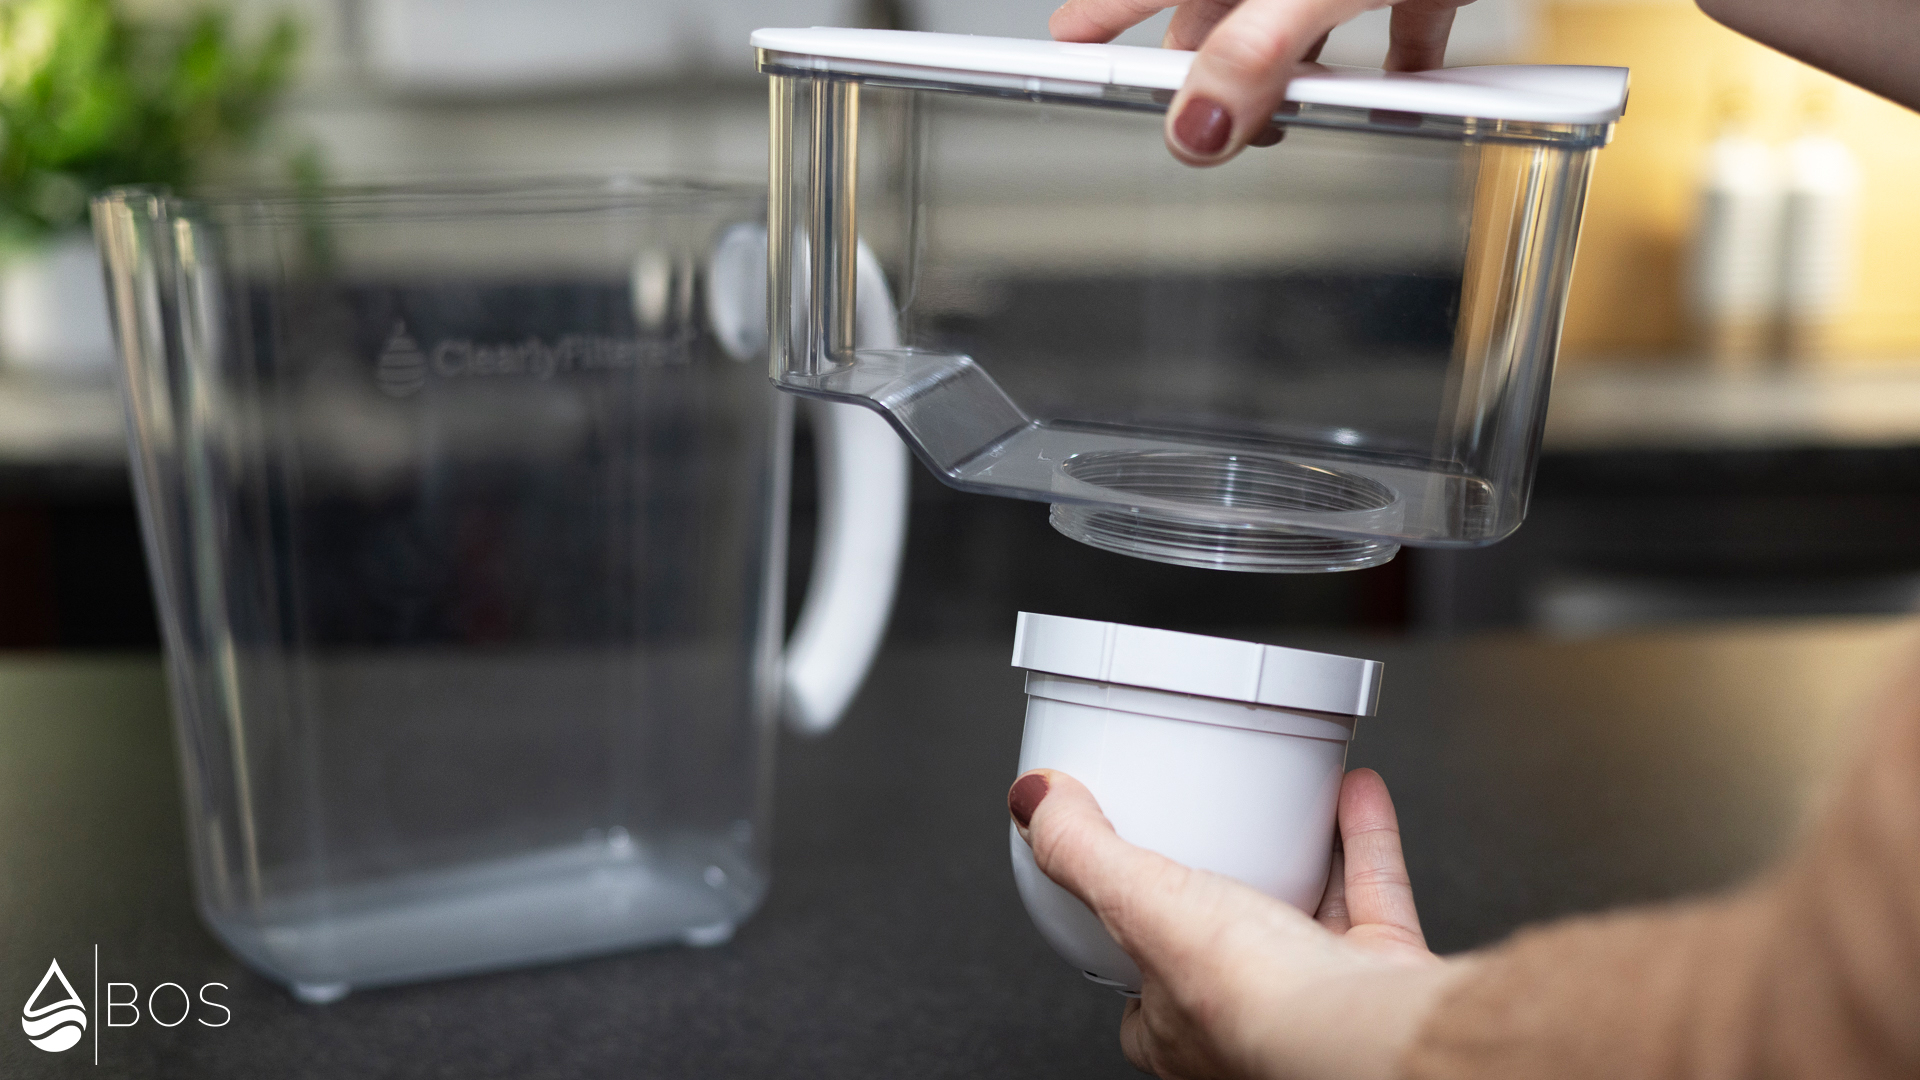
- Disconnect the filter from the priming disc/bag and twist it onto the threaded base of the pitcher reservoir.
- Lower the reservoir with attached filter into the pitcher body until it clicks into place. Open the reservoir lid and fill with cold or room temperature water.
- Close the lid and wait for the water to pass through the filter.
- Now your pitcher is ready to use.


2. Day-to-Day Use: /3.10
2.1 Speed & Water Capacity: /1.20
The Clearly Filtered Pitcher is a practical choice for daily use. For one, its reservoirs are large and well balanced (8.5-cup feed, 11.5-cup filtered capacity), so it can store enough water and requires fewer daily refills to keep your family hydrated – we estimate 3-4 refills for the average-sized US and US family households, respectively. This means you will not have to make repeated trips to the faucet, unlike with models that have smaller feed (or feed + filtered) reservoirs, which will need to be topped off repeatedly.
In addition, the Clearly Filtered filters fast enough to meet the daily water needs of the average-sized US households, and it can handle thirst bursts. That said, on-demand filtering takes patience. In our 2025 filtration speed test, the pitcher could filter 4 cups in 13:31 min. In 2024, it took more than twice as long (29:30 min), though we suspect the problems we had with the initial filter priming may be the culprit.
Finally, the pitcher fits both on the shelves and in the door of a standard fridge (dimensions: 5.25″x10.5″x11.8″), and thanks to the generous feed and filtered capacities, you can fill a large 40-oz bottle with a single refill.
2.2 Handling & Pouring: /1.15
The Clearly Filtered’s large handle provides a comfortable, secure grip and allows for fine pouring when using slow, controlled movement. However, it can produce a wide zone of splashing if pouring too quickly and unfiltered water may escape from the flip-top lid if tilted too steeply. To eliminate this problem, we recommend always refilling the pitcher to the top, and allowing it to process all water before pouring.
It is relatively heavy compared to the other pitchers we have tested, with a weight including the wet filter cartridge of 2 lb 15.6 oz. While that may be a disadvantage from a handling perspective, heavier weight can generally indicate sturdier construction (e.g., thicker plastic) and/or more filter media which is desirable for better filtration results.


2.3 Refilling: /0.75
The Clearly Filtered is easy to refill owing to its flip-top lid that opens on a hinge and provides plenty of room for filling. Also, the clear upper reservoir allows you to see how much water remains to be filtered, making sure that you don’t pour with unfiltered water left risking leaking.

3. Filter Replacements: /0.90
Filter replacements are very easy though there is no filter change indicator to alert you to do so. Rated filter life is 100 gallons. Assuming 300 gallons of yearly water consumption for the average household, we estimate that you will have to change the filter 3x annually.
Support BOS Water’s Mission!
Every coffee helps us test more products and bring you unbiased results!
Costs: /5.00
Based on value for money, the Clearly Filtered Water Pitcher achieved a cost score of 3.50 out of 5.00, indicating it is relatively expensive for what it offers compared to competing pitchers (a score of 4.00 represents average value). Notably, both its upfront price and annual filter replacement cost are well above average compared to the other pitchers we tested.
1. Upfront Price
As of September 16, 2025, the Clearly Filtered is priced at $100. Applying our 10% discount code reduces the upfront cost to $90, which is still well above the $58.53 average across all the water filter pitchers we tested. Choosing a filter subscription would provide you another 10% off.
2. Long-Term Expenses for Filter Replacements
Based on 300 gallons consumption and a 100-gallon filter life, we estimate $155 in annual filter replacement costs, which is well above the $120.13 average across all the water filter pitchers we tested. That said, you can save 10% with a filter subscription.
3. Product Warranty
The system is covered by a 2-year warranty.
4. Other Cost Factors
- The pitcher is made from medical-grade Tritan which, according to Clearly Filtered, is free from BPA, BPS, phthalate, and estrogen & androgen activity.
Additional
1. Frequent Customer Complaints
We read about issues with clogged filters or slow flow, as well as reservoir and lid instability, leading to leaking and spills. Other customers complained of pouring issues or found the pitcher to be too heavy or bulky.
While we experienced somewhat slow filtration during our 2024 test, once we figured out the priming bag, filtration sped up considerably. However, we agree that the Clearly Filtered needs to be poured with a bit more care than some of the other pitchers to minimize splashing, for example. And while its heaviness may be a con for some, it could also be viewed as a tradeoff for better quality and performance.
Bottom Line: Our #1 Overall Pitcher (/5.00)
Filtration weighted at 60%, and usability and cost at 20% each, the Clearly Filtered pitcher scored a final rating of 4.22 out of 5.00.
If you are in the market for a water filter pitcher, the Clearly Filtered is our top pick. It takes the #1 spot for most effective filtration as it completely removed most contaminants in our lab tests, comes with extensive third-party testing against 355 different impurities, and its filtered water was odorless and tasted much better than our tap water (clean taste in 2024). It clinched the best all-rounder status as well, as it is easy to setup, use, and maintain (even if filtration is a little on the slow side). High quality comes at a price, however, and the Clearly Filtered costs well above average – both for the initial purchase and filter replacements.
(Use Code BOS10 for 10% Off!)
Further Reading
About the Author(s)

Sara has been a lifelong home-improvement fan (she’s been hooked on This Old House since she was five) and taught herself any project she didn’t already know by watching YouTube tutorials. She is also an award-winning filmmaker. Armed with this skillset, Sara installs, primes, samples, uses, and maintains nearly every point-of-use water treatment systems we test – then brings her results to life on camera for our YouTube channel.

Mike is a former team member who made his mark by contributing to our first big water filter pitcher comparison video and reviewing a couple POE water treatment systems. Beyond the world of water solutions, Mike is a full-time blogger and YouTuber alongside his wife, Ashley. Together, they’ve transformed their passions into a creative space called Joyfully Growing, where they share DIY tutorials and simple home improvement tips to help others love the homes they’re in.

Raoul has a background in mechanical engineering and has been writing about home water treatment since 2015. He designs our product review processes, analyzes the results, and ties everything together. As editor-in-chief, he tries hard to keep the whole operation running smoothly behind the scenes.