

Our Code of Ethics serves as the foundation for everything we do at BOS Water® and guides our content creation process.
Code of Ethics
The principles we adhere to are simple:
- Objectivity: We deliver unbiased, fact-based content grounded in both hands-on experience and expert knowledge.
- Accuracy: Every article is double- and triple-checked to ensure the highest level of accuracy.
- Transparency: We openly share our methods, data sources, and any affiliations – no hidden agendas.
- Integrity: We maintain honest and clear communication at all times.
Our Research Process
Our team understands the importance of reliable and up-to-date information when discussing home water quality. As such, we conduct extensive research using a variety of trusted sources including authoritative bodies (CDC, EPA, NSF), peer-reviewed studies, and expert forums.
Guidelines for Editing and Publishing
To keep our content clear and reliable, we:
- Clearly outline our opinions.
- Cite credible sources and link to original studies where applicable.
- Avoid hyperbole and stick to verifiable facts.
- Perform thorough proofreading and spell-checking before publication.
- Update articles and reviews based on new data or when corrections emerge.
Open to Feedback and Corrections
Mistakes can happen. If you spot an error or have suggestions, please let us know via our contact page. We’ll try to review your feedback swiftly and update our content to maintain accuracy and transparency.
Content Written by Humans, Not AI
Every word you read on BOS Water is written and vetted by real people. We do use AI tools for select minor, repetitive tasks behind the scenes, but the writing, research, and editorial judgment behind our content come from our team. We believe human expertise is essential for delivering the depth and nuance you deserve.
Our Review Process
To illustrate our methodology, we’ll use our countertop reverse osmosis comparison as an example. Below, you’ll find a detailed breakdown of each step in our product review process and an explanation of how we develop our recommendations – giving you full insight into the most critical part of our work.
Note: For readability, we refer only to “products” below, but every step applies equally to the services we test.
Step 1: Researching & Selecting the Right Products to Review
Cost is understandably important to most shoppers, so we always try to evaluate a variety of water treatment products from all price points. But in a perfect world, cost should take a back seat to other, more vital considerations, such as contaminant reduction capabilities or practical usability features.
We want our reviews to represent a selection of the best products available. For a holistic approach, we first identify all the crucial criteria that must be considered for each type of system and then pick our products accordingly. We also like to review products that are popular in their respective categories, which we determine by checking Google search volume, Amazon bestseller lists, and our YouTube channel’s comment section.
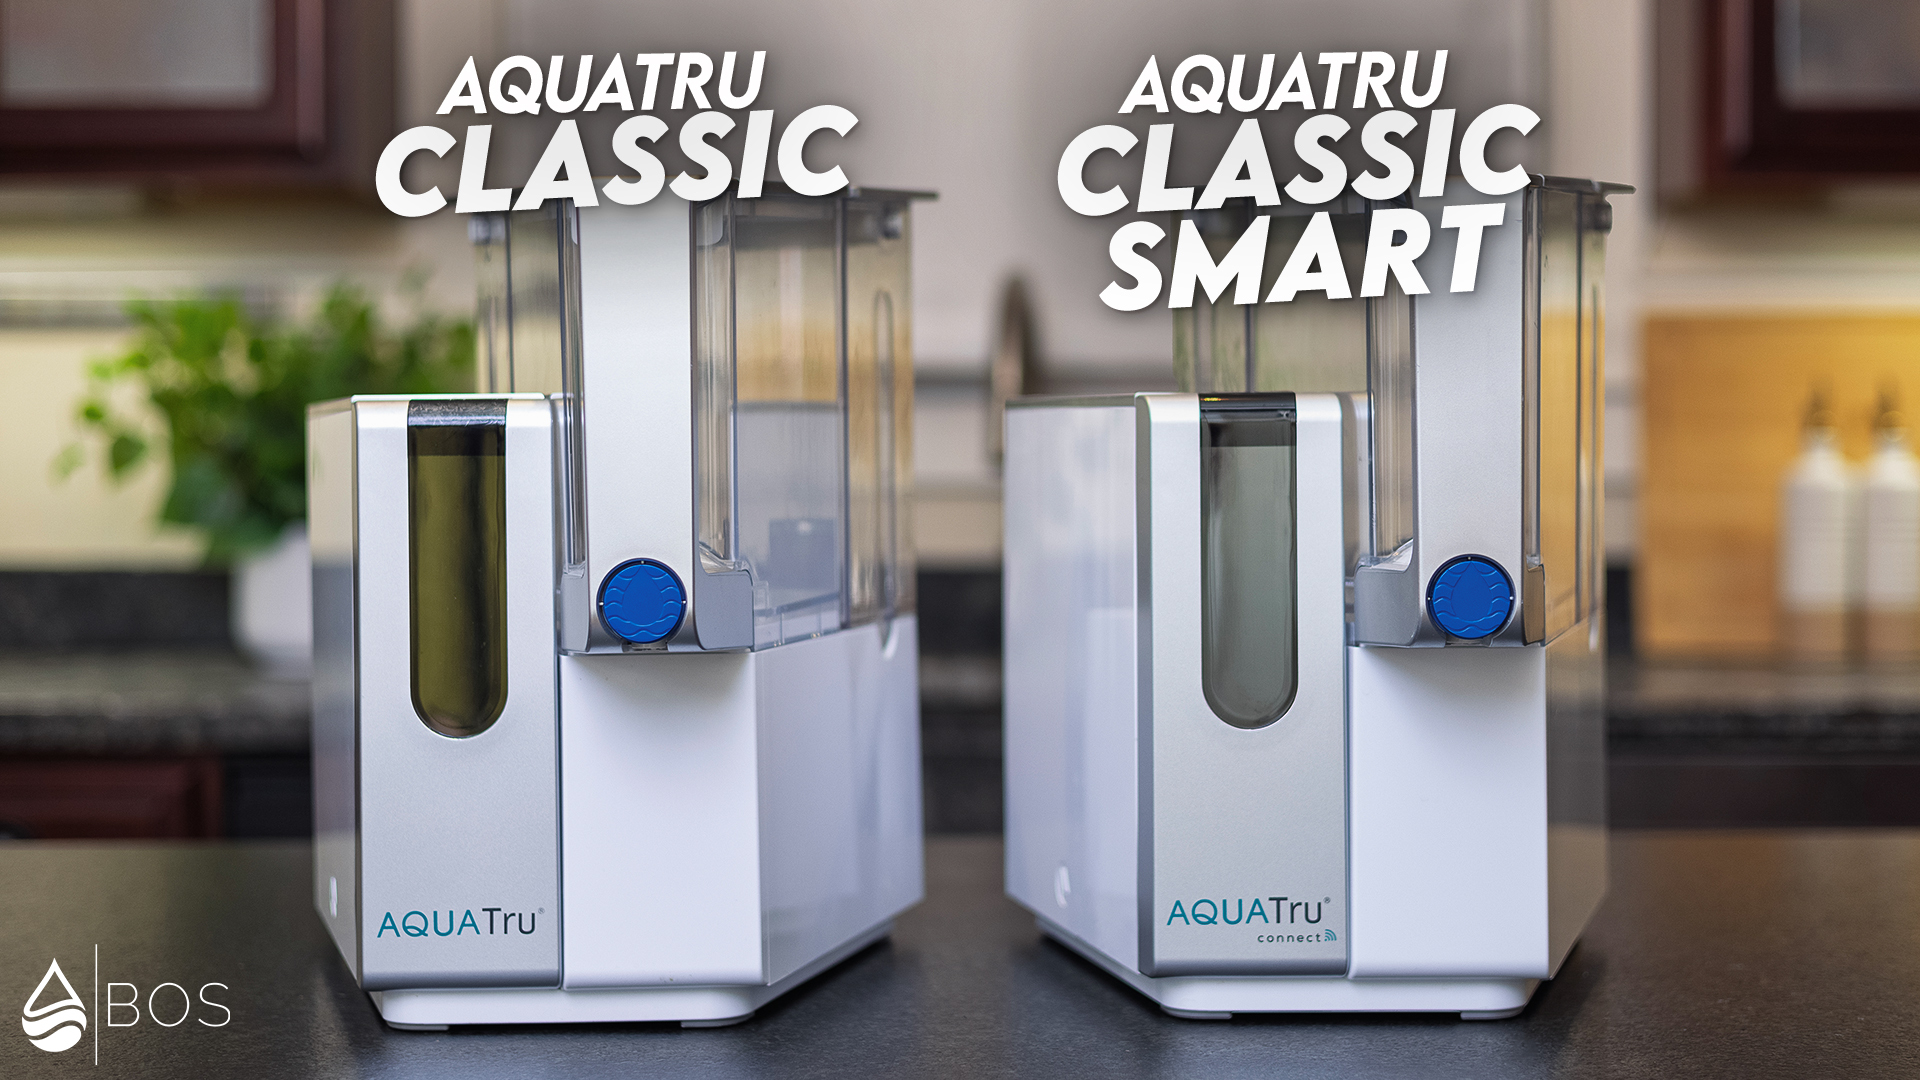
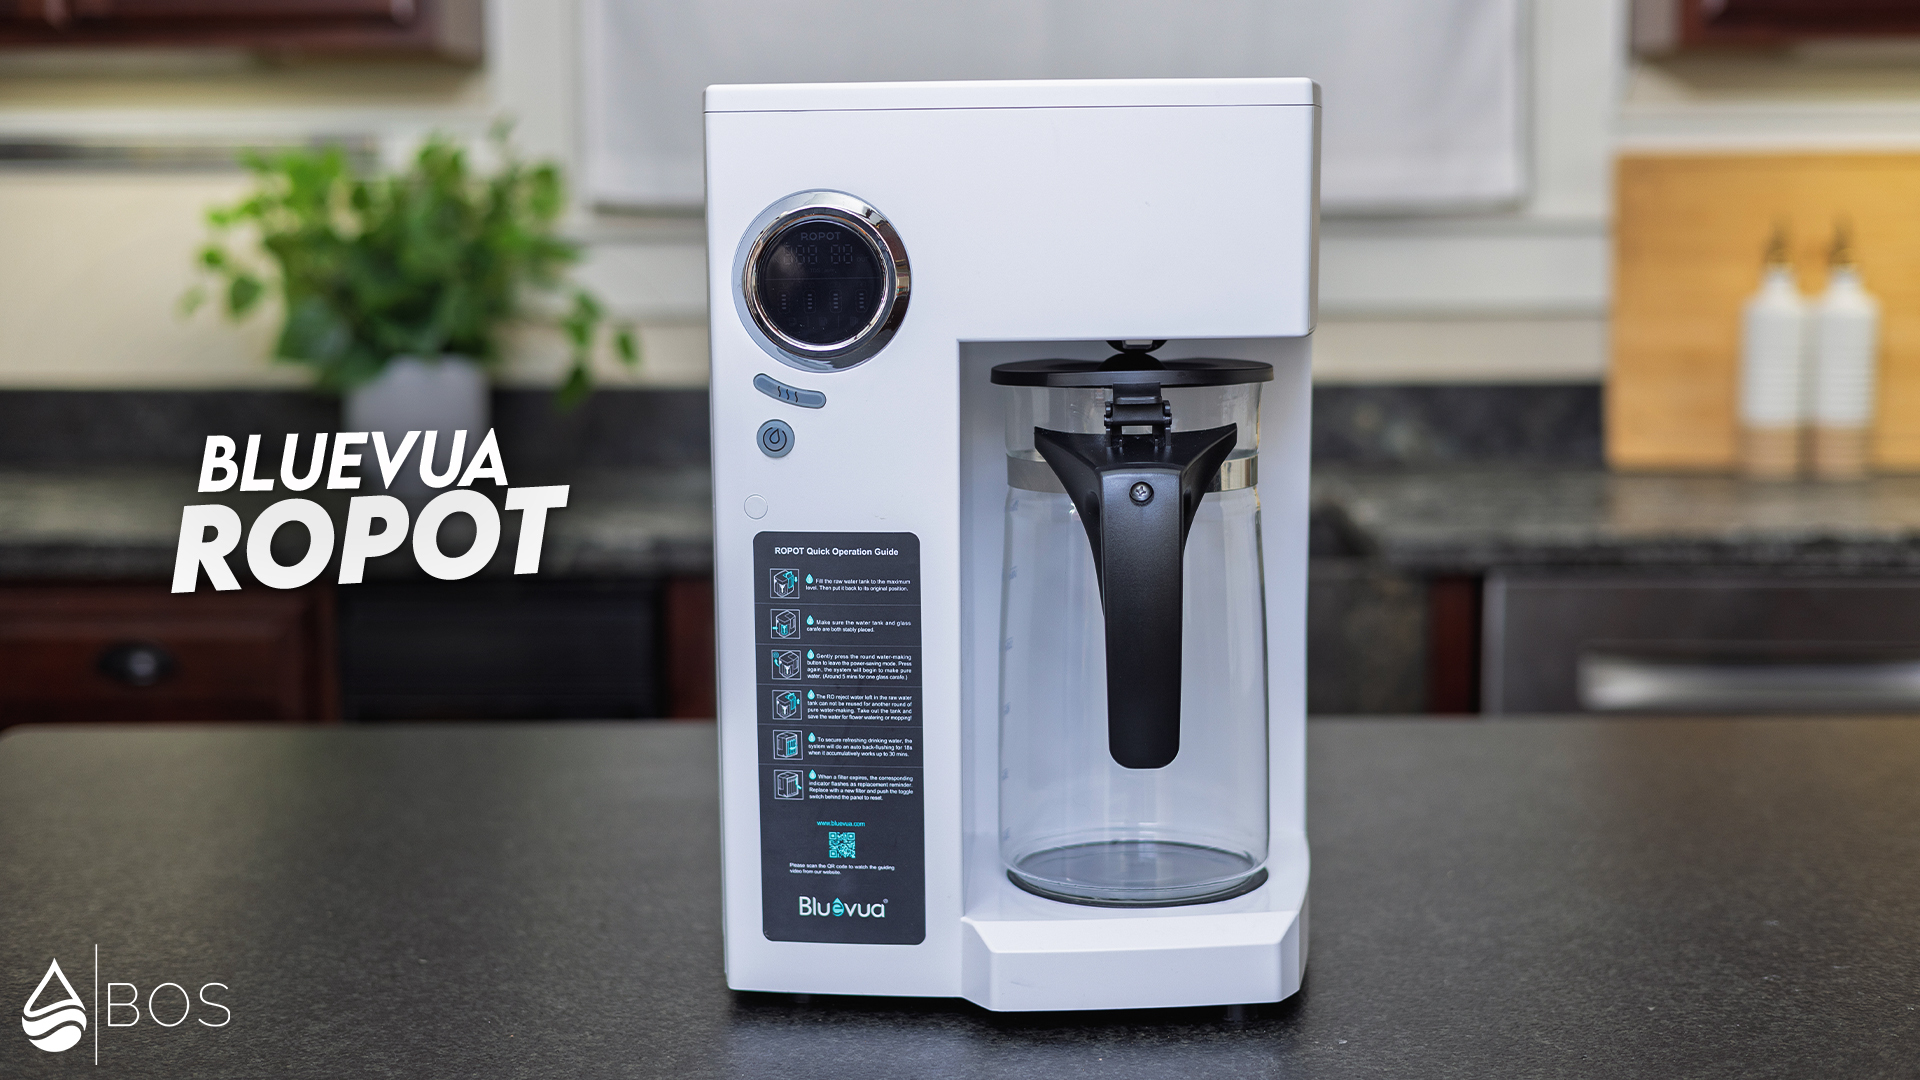
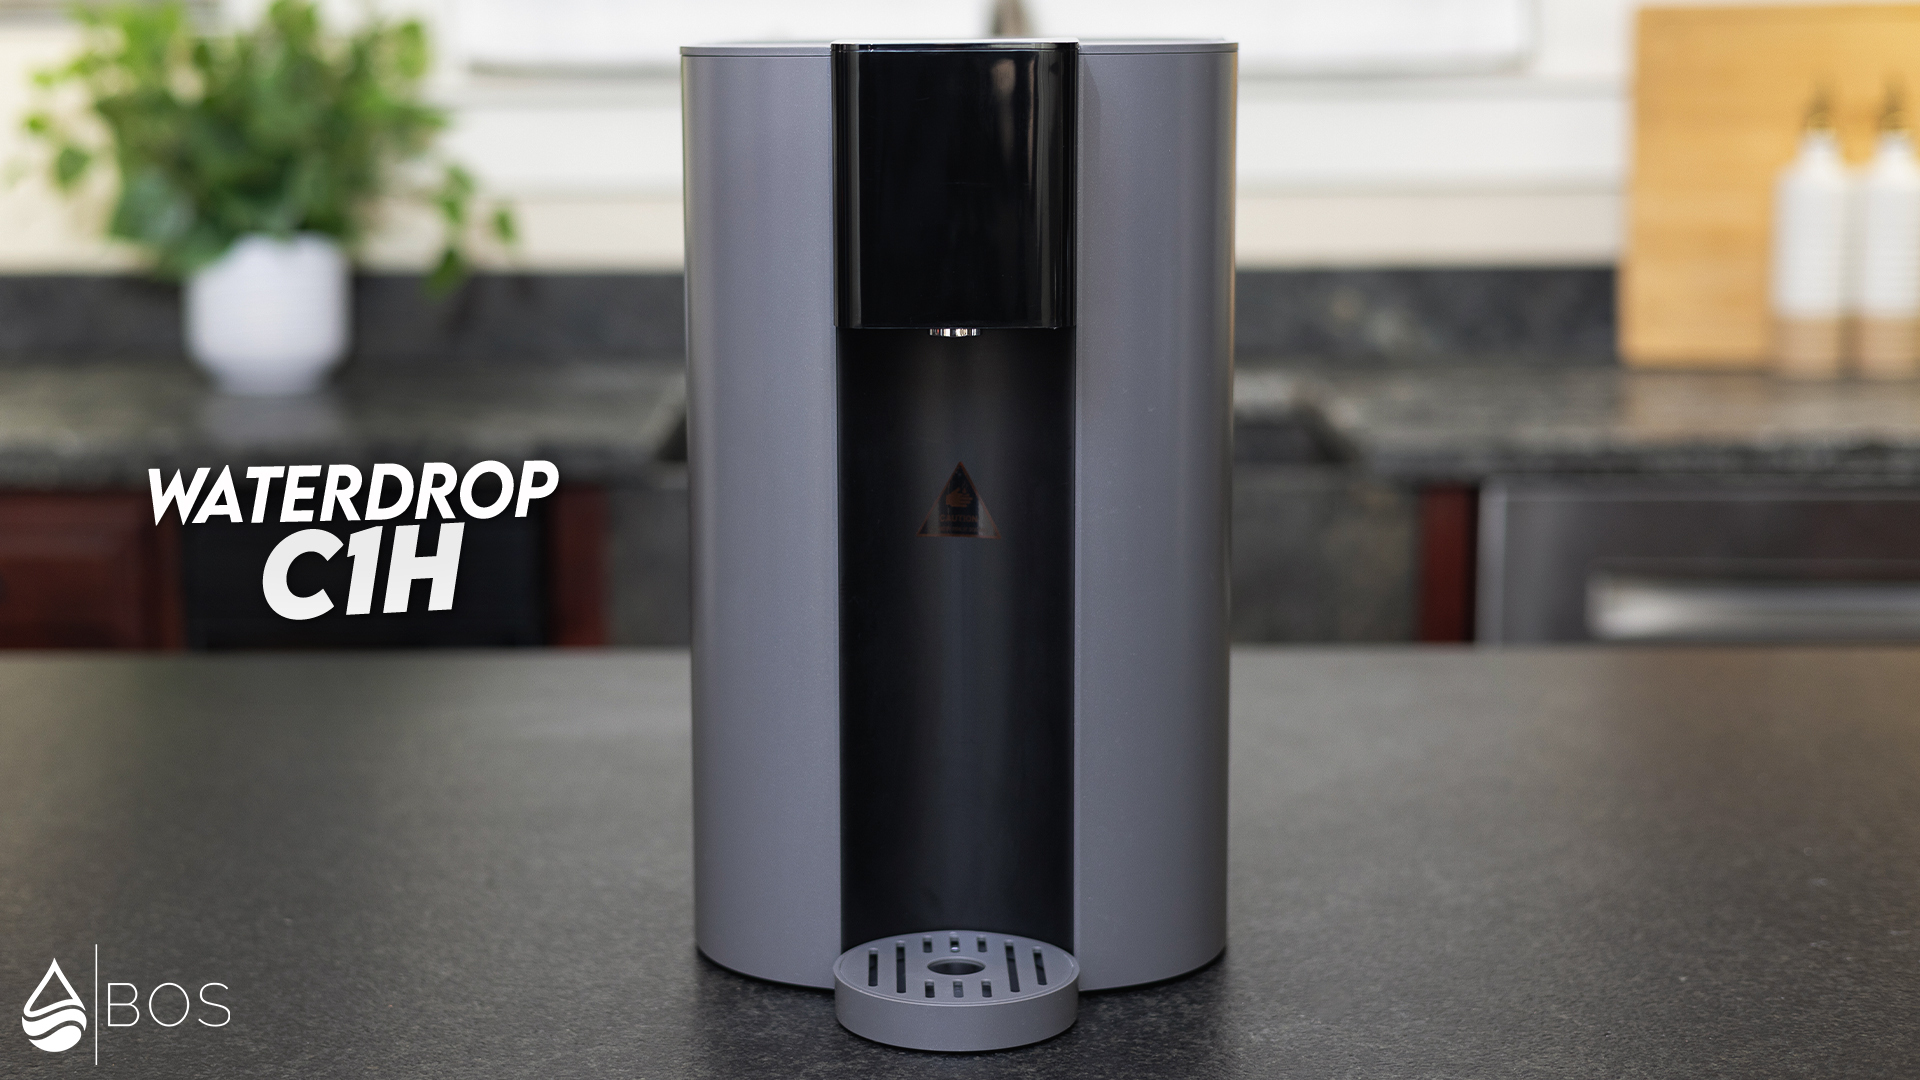
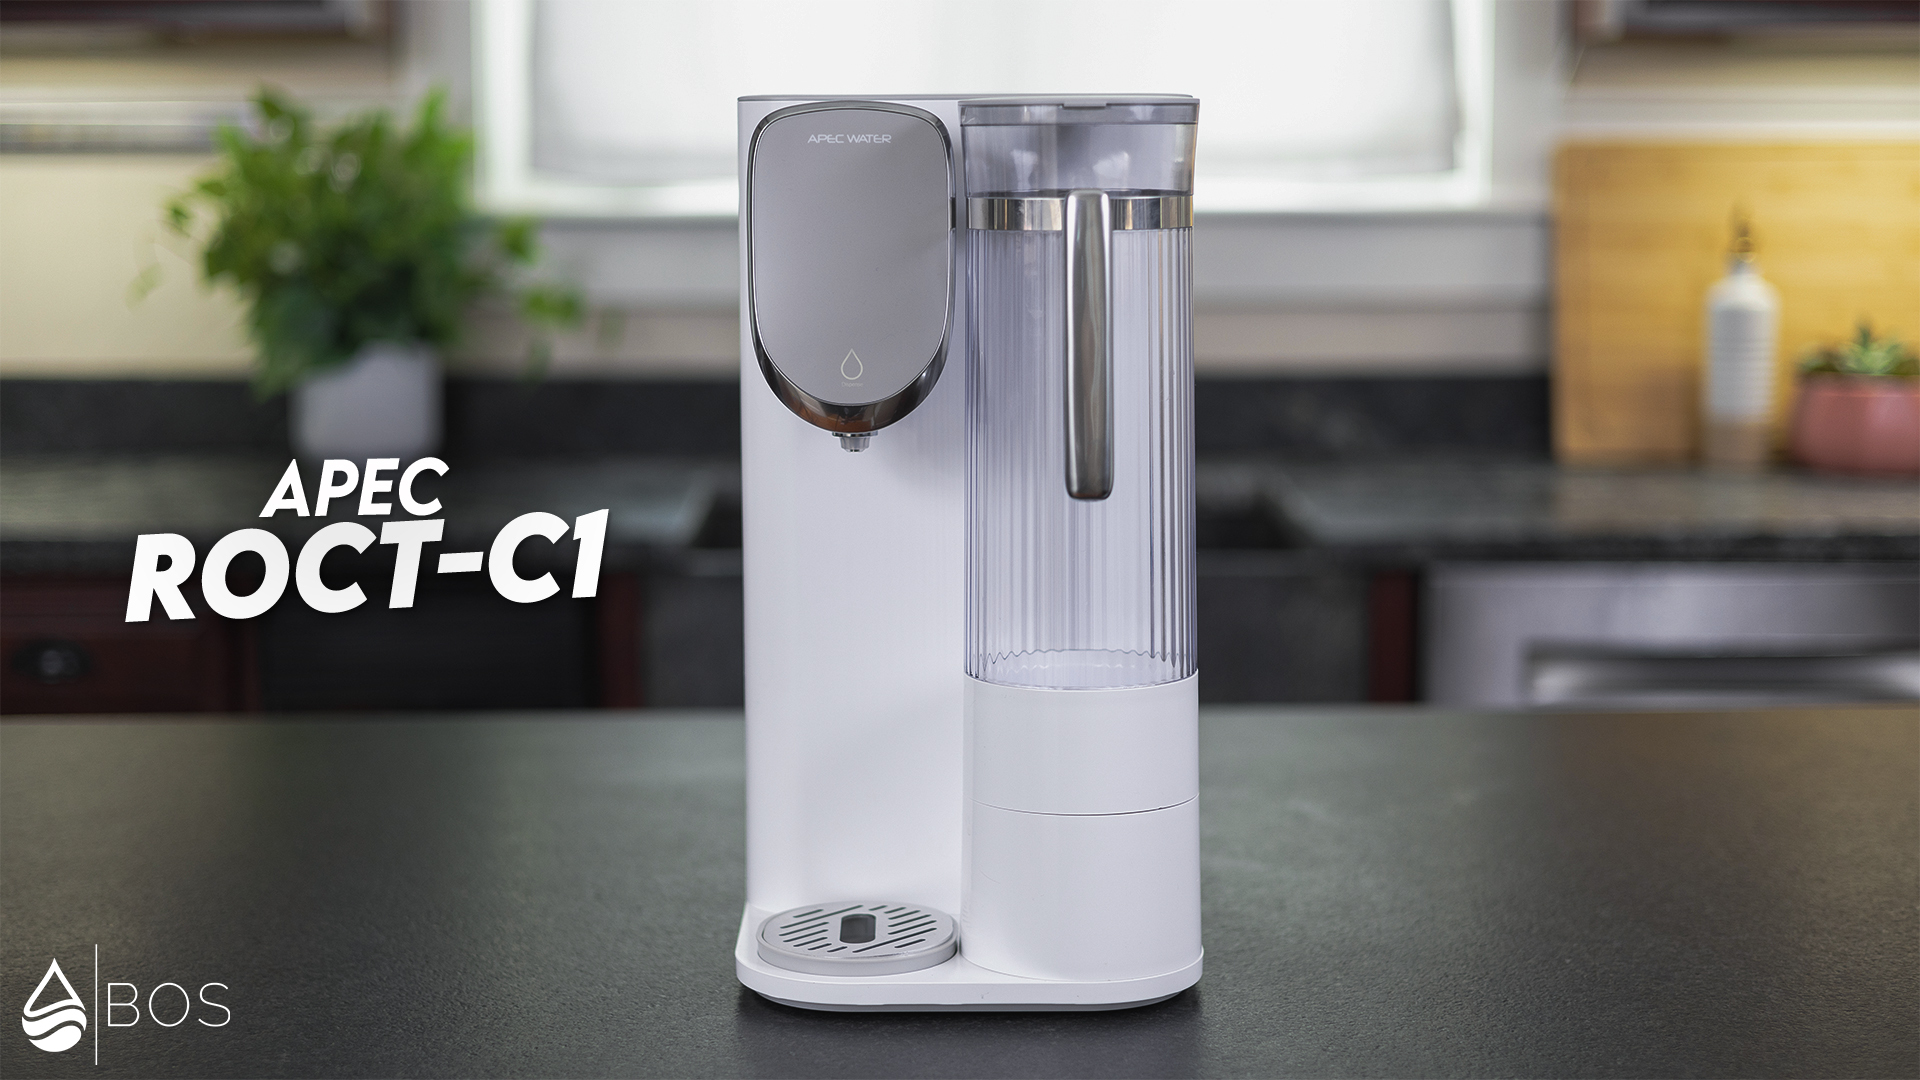
With our initial list in hand, we conduct due diligence on each item. We review product manuals, descriptions, performance data sheets, warranty terms, third-party certification sites, and even talk to some of the companies directly. We also peruse third-party customer ratings and reviews whenever possible, as we might stumble upon one or more product aspects that we haven’t considered yet. That said, this also involves identifying and ignoring fakes which can be challenging due to the rise of AI.
Finally, we compile all relevant attributes into a comparison table. For countertop reverse osmosis systems, this includes:
- Upfront price and long-term cost – We check pricing information for all systems on the same day. Ongoing discounts are taken into account whereas short-term sales are ignored. Long-term filter replacement cost is based on average filter life as claimed by the manufacturer and, for countertop RO systems, a yearly consumption of 500 gallons of filtered water. For systems that lack NSF/ANSI-certified contaminants or extensive third-party testing to full filter life, we may suggest replacing the cartridges more frequently – in which case, we base our long-term cost projections on a more conservative filter life estimate. Bulk discounts for replacement filters are taken into account, too. For both upfront and long-term costs, our information is usually based on each company’s suggested retail prices found on the official websites or Amazon.com.
- NSF/ANSI certifications for contaminant reduction – During this initial research stage, these certifications are of utmost importance to us as they’re 100% independent and testing against NSF/ANSI standards is highly standardized. We check the NSF International database, the IAPMO R&T database, and the WQA database. If we do find a certification, we check for the (types of) impurities covered and missing. We also check performance data sheets if provided.
- Third-party NSF/ANSI testing and other test data – We also take a company’s own test data into account – but with caution, because this kind of testing often only covers the beginning of the filter life, and it is not always independent.
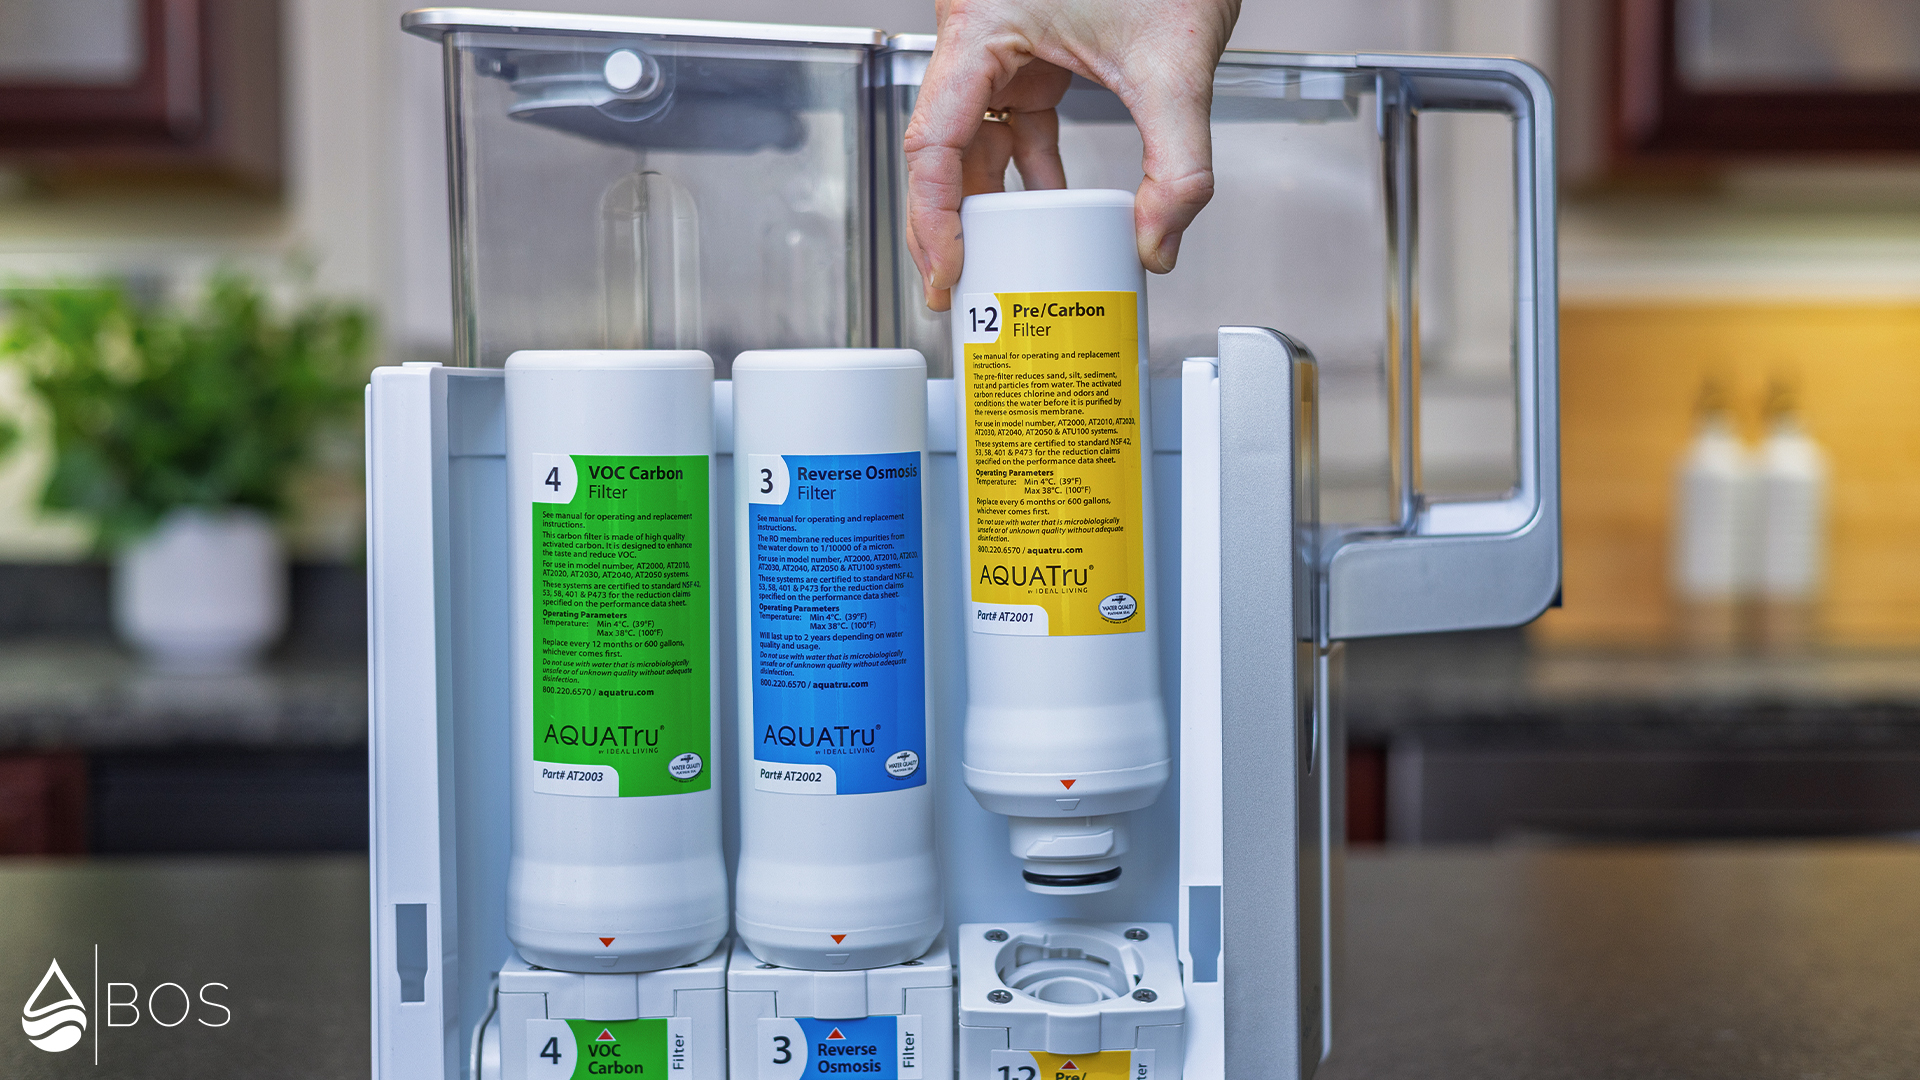
- Filtration process – We investigate the number of filter cartridges, the types of filtration media they contain, and the number of filtration stages for each countertop RO. This may include checking for remineralization filters (optional or standard) as well as UV light treatment.
- Filter life indicators – Most countertop ROs have indicator lights telling you when it’s time to replace the filter(s). We verify this and also determine whether the system enables app connectivity, which allows you to track filter performance via your phone or tablet.
- Hot & cold temperatures – For systems that offer hot and/or cold water, we research the advertised temperature presets or ranges.
- Product warranty and satisfaction (money-back) guarantee – We read the actual terms so you know exactly how long your future investment will be protected and precisely what will be covered. We also check the terms of any money-back guarantees, including things like restocking fees, return windows, and who covers return shipping, so you know what to expect if it ends up not being the right fit.
- Made in USA or UK – Some consumers may feel that US- or UK-made goods are subject to more rigorous regulatory standards, ensuring better safety and longevity. Plus, for domestic buyers, “home-grown” products are not subject to the supply-chain bottlenecks or tariffs that affect imported items. This is important because you will need to replace components – such as filters – periodically.
- Third-party customer feedback – We check each countertop RO’s third-party ratings on Amazon.com, Walmart.com, and the company’s own website. We may also check Homedepot.com and similar sites. We digest all the information but home in on frequently mentioned issues.
- Build materials – When disclosed, we list the construction materials used in these systems. Some units feature borosilicate glass carafes or BPA, BPS, and phthalate-free Tritan plastic components, for example.
- Additional product aspects – Such as dimensions, feed and filtered water tank size(s), volume presets, TDS displays, child safety locks for hot water, boiling point correction, automatic or manual flushing (to counter TDS creep), etc.
Overview: Main Scoring Categories
With this preliminary product research underway, our evaluation process has already begun to take shape.
To help you understand how we rate each product before we dive into the details, we have outlined our main scoring categories below.
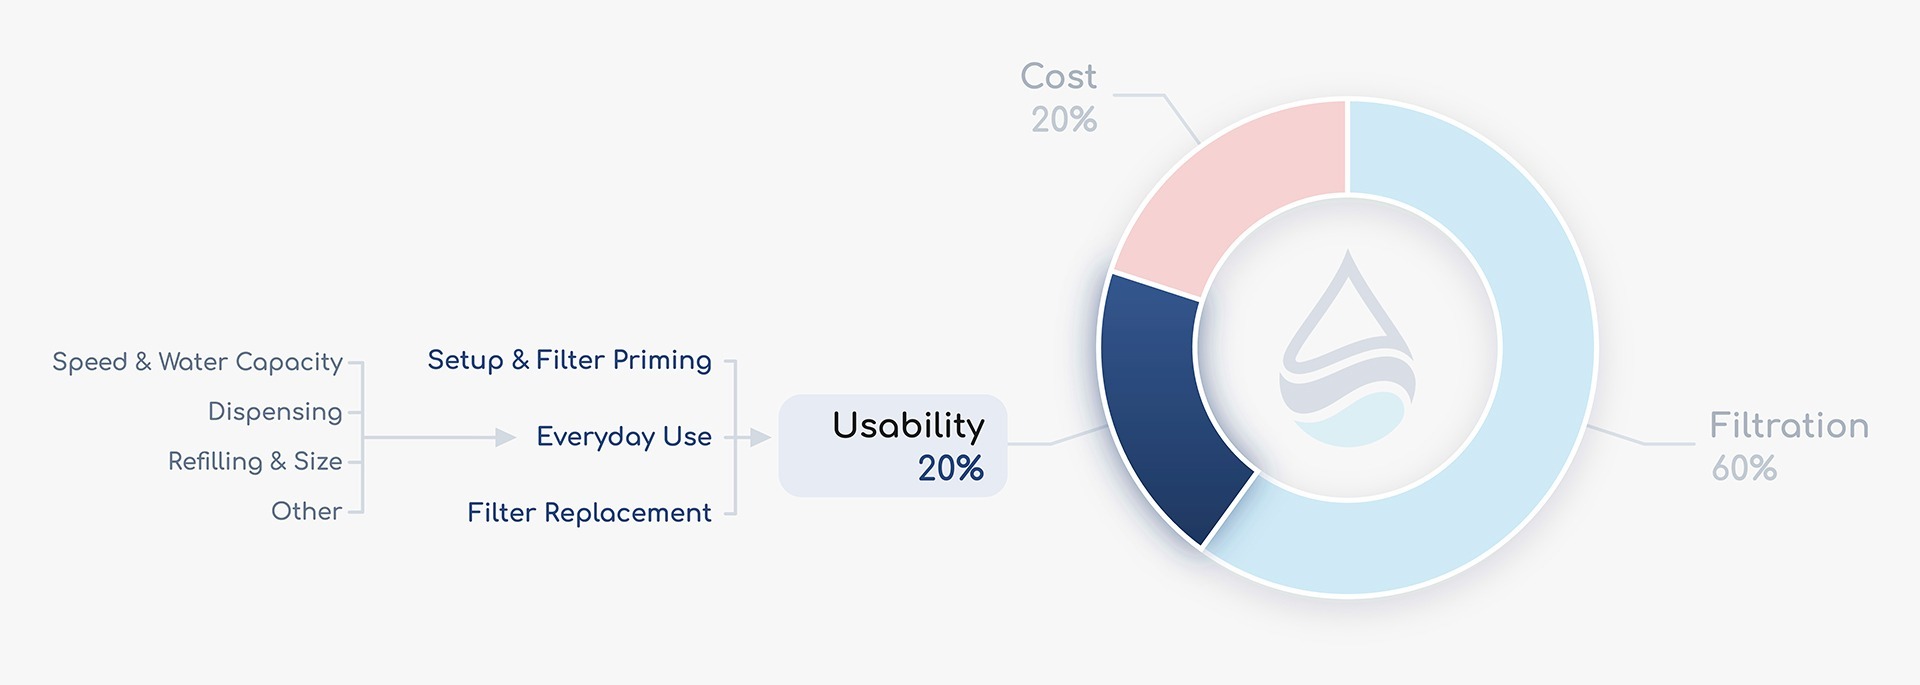
The Final Rating (Score) for each system is calculated using a 5.00-point scale across three weighted categories:
- Filtration: 60%
- Usability: 20%
- Costs: 20%
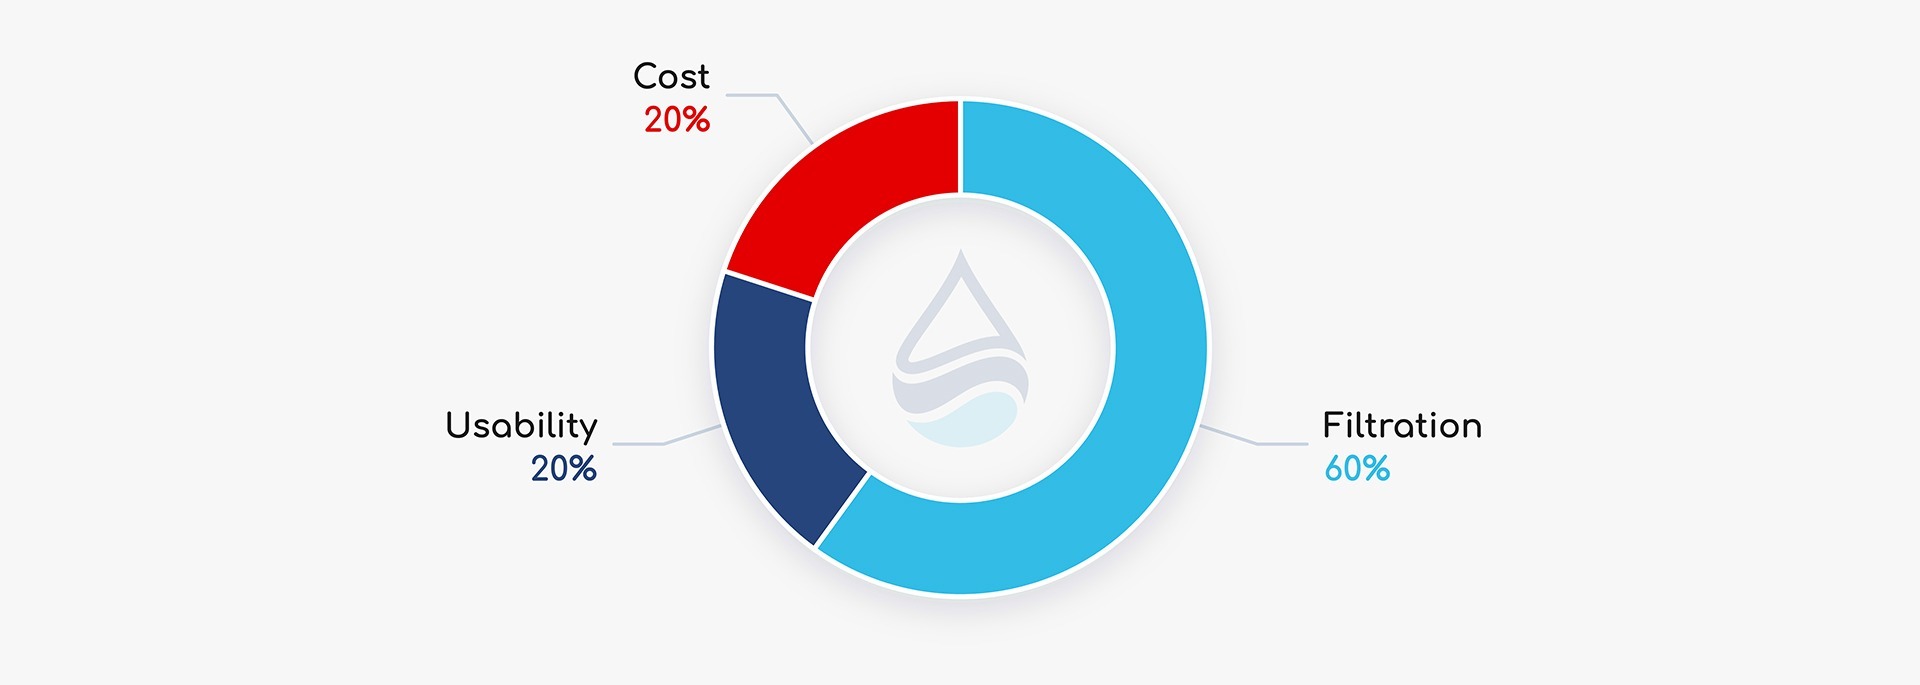
We believe the most important function of any water filter is to remove potentially harmful contaminants, so the Filtration Score accounts for the largest proportion of our Final Score. Throughout this guide, we will clearly indicate which category we are focusing on as we discuss various sub-scores and grading criteria.
NSF/ANSI Certifications and Other Third-Party Testing: A Closer Look
When analyzing water filters, we highly value NSF/ANSI certifications, which provide objective, standardized proof of contaminant removal. Therefore, we award NSF Points to every system we review and use it to assign an NSF Score. This score reflects both the number of NSF/ANSI-certified contaminants and their relative importance according to well-documented health risks.
Systems lacking NSF/ANSI certifications can still receive points if they have third-party test data, but we give more credence (and, therefore, points) to actual certified contaminants, as this is the most unbiased metric to evaluate contaminant reduction.
As we’ll discuss shortly, this NSF Score is subsequently combined with other data to provide the Filtration Score mentioned above.
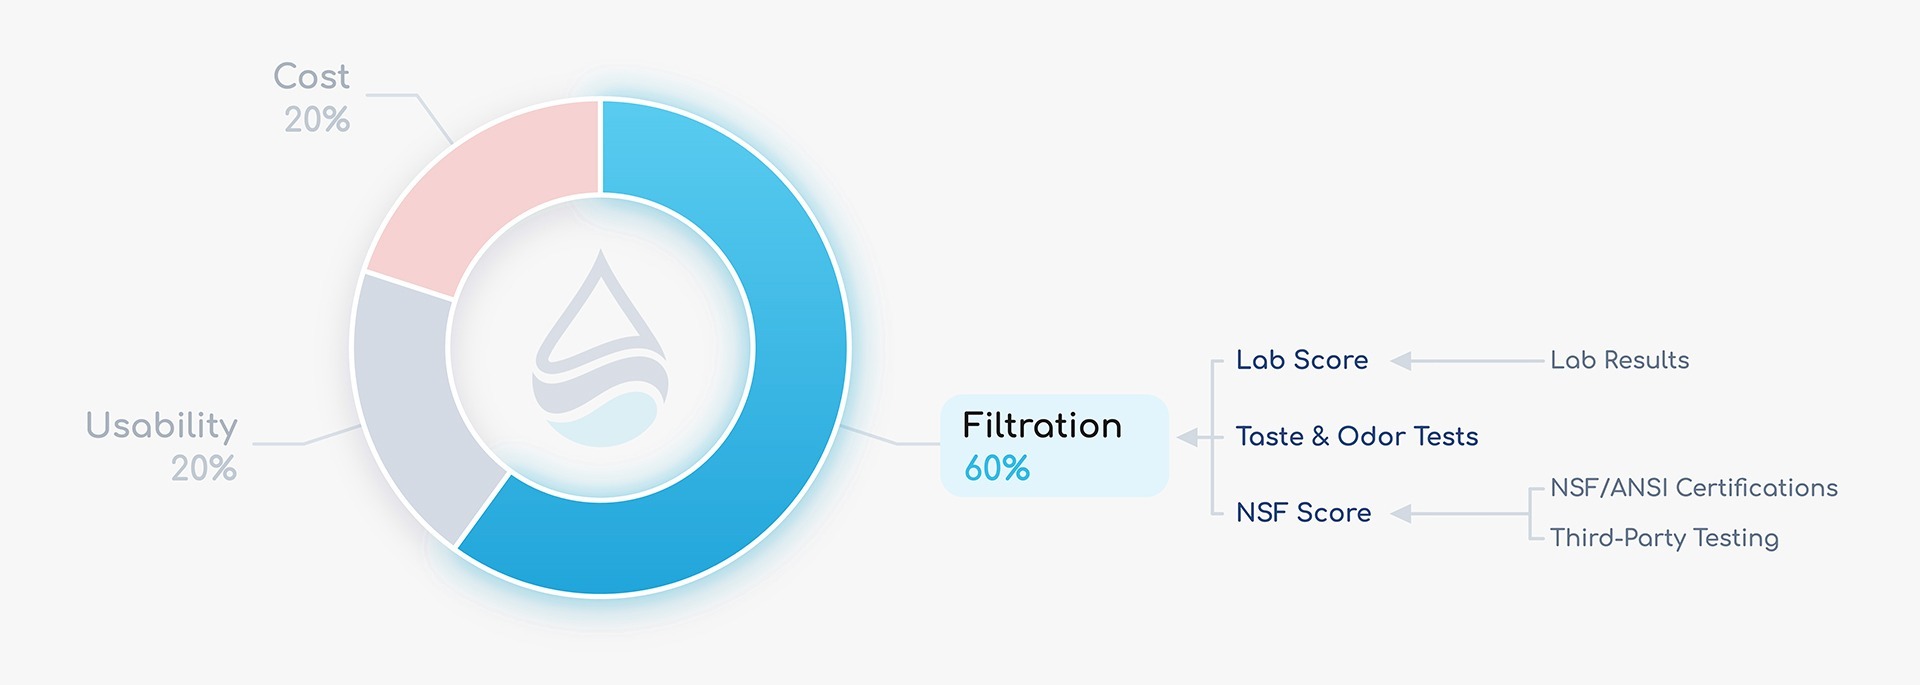
Here’s an example of how we calculated the NSF Score for our highest-rated countertop RO system, the AquaTru Classic.
As shown in the table below, contaminants are divided into High Priority, Regular Priority, Low Priority, and Extra, with more points assigned to higher-priority substances. We based these categories on a few factors: how common the contaminant is in public water supplies, how harmful it can be, how difficult it is to remove, and how frequently products are actually certified or tested for it. That last point matters because certification for some contaminants is still rare – not every contaminant even has an established NSF/ANSI standard yet – so we didn’t want to set an unreasonably high bar that would penalize most products for something largely outside their control. For RO systems, we also give points for TDS testing.
More points are awarded to NSF/ANSI-certified contaminants relative to contaminants that were only third-party tested. For systems other than ROs, such as gravity filters, impurities third-party tested to 100-200% filter life received more points than those that were tested to an unknown water volume or filter life.
However, ROs are frequently tested only at the beginning of the filter life, as NSF/ANSI 58 standards only require testing over the first 7 days. RO systems are also generally highly effective at contaminant removal – this is well-documented in independent studies, and our own testing data backs it up. Because of this, we believe full-filter-life testing matters less for ROs than it might for other systems, so we allotted the same number of points regardless of the duration of third-party testing.
Finally, points are deducted if the system has neither NSF/ANSI-certified contaminants nor third-party data for the listed substances (excluding those in the Extra category).
Example NSF Score Calculation for Countertop RO Systems – AquaTru Classic
| Contaminant (Group) | NSF-Certified | NSF/Other Standards – Tested to 100/200% of Filter Life | NSF/Other Tested (Test Life Unknown) | Neither Certified nor Tested | Score |
|---|---|---|---|---|---|
| High Priority | |||||
| Lead | ✖ | 0.1 | |||
| 1+ Radiologicals | ✖ | 0.1 | |||
| Microplastic | ✖ | 0.1 | |||
| Fluoride | ✖ | 0.1 | |||
| Arsenic | ✖ | 0.1 | |||
| Barium | ✖ | 0.1 | |||
| Nitrate, Nitrite or Both | ✖ | 0.1 | |||
| Chromium 6 | ✖ | 0.1 | |||
| TDS (ROs only) | ✖ | 0.2 | |||
| Regular Priority | |||||
| PFAS (PFOA/PFOS) | ✖ | 0.03 | |||
| Chloramine | ✖ | 0.03 | |||
| Asbestos | ✖ | -0.03 | |||
| Low Priority | |||||
| Cadmium | ✖ | -0.03 | |||
| 5+ Organics: Group I (401 Emerging Contaminants and others) | ✖ | 0.03 | |||
| 5+ Organics: Group II (VOCs, Chloroform, DBPs) | ✖ | 0.03 | |||
| Neither Organics I nor Organics II? | 0 | ||||
| Mercury | ✖ | -0.03 | |||
| Extras – Not the “Must Haves” | |||||
| Bacteria | ✖ | 0 | |||
| Cyst | ✖ | 0.03 | |||
| Copper | ✖ | 0.03 | |||
| Total PFAS | ✖ | 0 | |||
| Selenium | ✖ | 0.03 | |||
| Cyanide | ✖ | 0 | |||
| Total Points | 1.12 |
Based off this rubric, the AquaTru Classic scored a total of 1.12 NSF Points.
To convert NSF Points into an NSF Score, we use a formula. The formula limits the highest achievable NSF Score to 1.0 for all systems. The lowest achievable score is -1.0 for regular water filters and -0.5 for reverse osmosis systems. As noted above, RO systems offer highly effective contaminant reduction, so we opted to use a less stringent lower limit for the NSF score to avoid overly penalizing systems with little to no certifications.
Step 2: Getting Our Hands on the Products
The next step is to get our hands on all the products on our list. In the past, we used to request free samples from manufacturers to help manage costs. Frequently, our request was declined and we purchased the item outright – always directly from the manufacturer or an authorized dealer to ensure authenticity and avoid counterfeits.
Our current policy is to purchase all equipment ourselves rather than request a comped unit for our testing. Going forward, we would only consider accepting a freebie if it’s the sole option at that time – such as getting a product to test before it officially launches.
Additionally, we only test products that are brand-new unless explicitly noted otherwise.
Step 3: Testing

We do not test performance over the entire product lifespan – this would be impractical given the sheer volume of systems we evaluate. Also, all products are tested under a unique set of real-life conditions and on our specific water supplies. As such, our testing depicts only a snapshot of how each product performs, and the results are not comprehensive or conclusive. A product may perform differently when used differently and/or on a different water supply.
During this phase, we complete our comparison table by thoroughly testing all aspects that require hands-on evaluation.
To ensure comparable results, we adhere to standardized testing procedures. Through years of experience and rigorous research, we have continually evolved our methodologies to provide you with the most reliable, accurate data possible.
Continuing with countertop RO systems as our example, we perform the following:
- Lab testing – We conduct our own lab testing by sending water samples to a professional and independent lab to determine each filter’s real-life contaminant reduction capabilities. The results of the lab testing are input into our in-house tool to produce a numerical Lab Results Score (more details below).
- Taste & odor test – We taste and smell a sample of freshly filtered water, making note of any off-flavors or odors. This generates the Taste/Odor Score (more details below).
- Usability – Usability testing is comprehensive and starts from the moment of unboxing. Though not an all-inclusive list, a few of the key aspects that are evaluated to calculate the Usability Score (more details below) include:
- The initial installation process (including the quality of the user manual/instructions and availability of tutorial videos), filter priming, and connecting to any linked apps.
- Day-to-day use, including:
- Filtration/Dispensing speed tests – measured for 1 and 4 cups (before and after pre-processing; more details below).
- Water capacity: feed/clean tank size(s), the maximum amount of water that can be dispensed at one time, number of daily refills, etc.
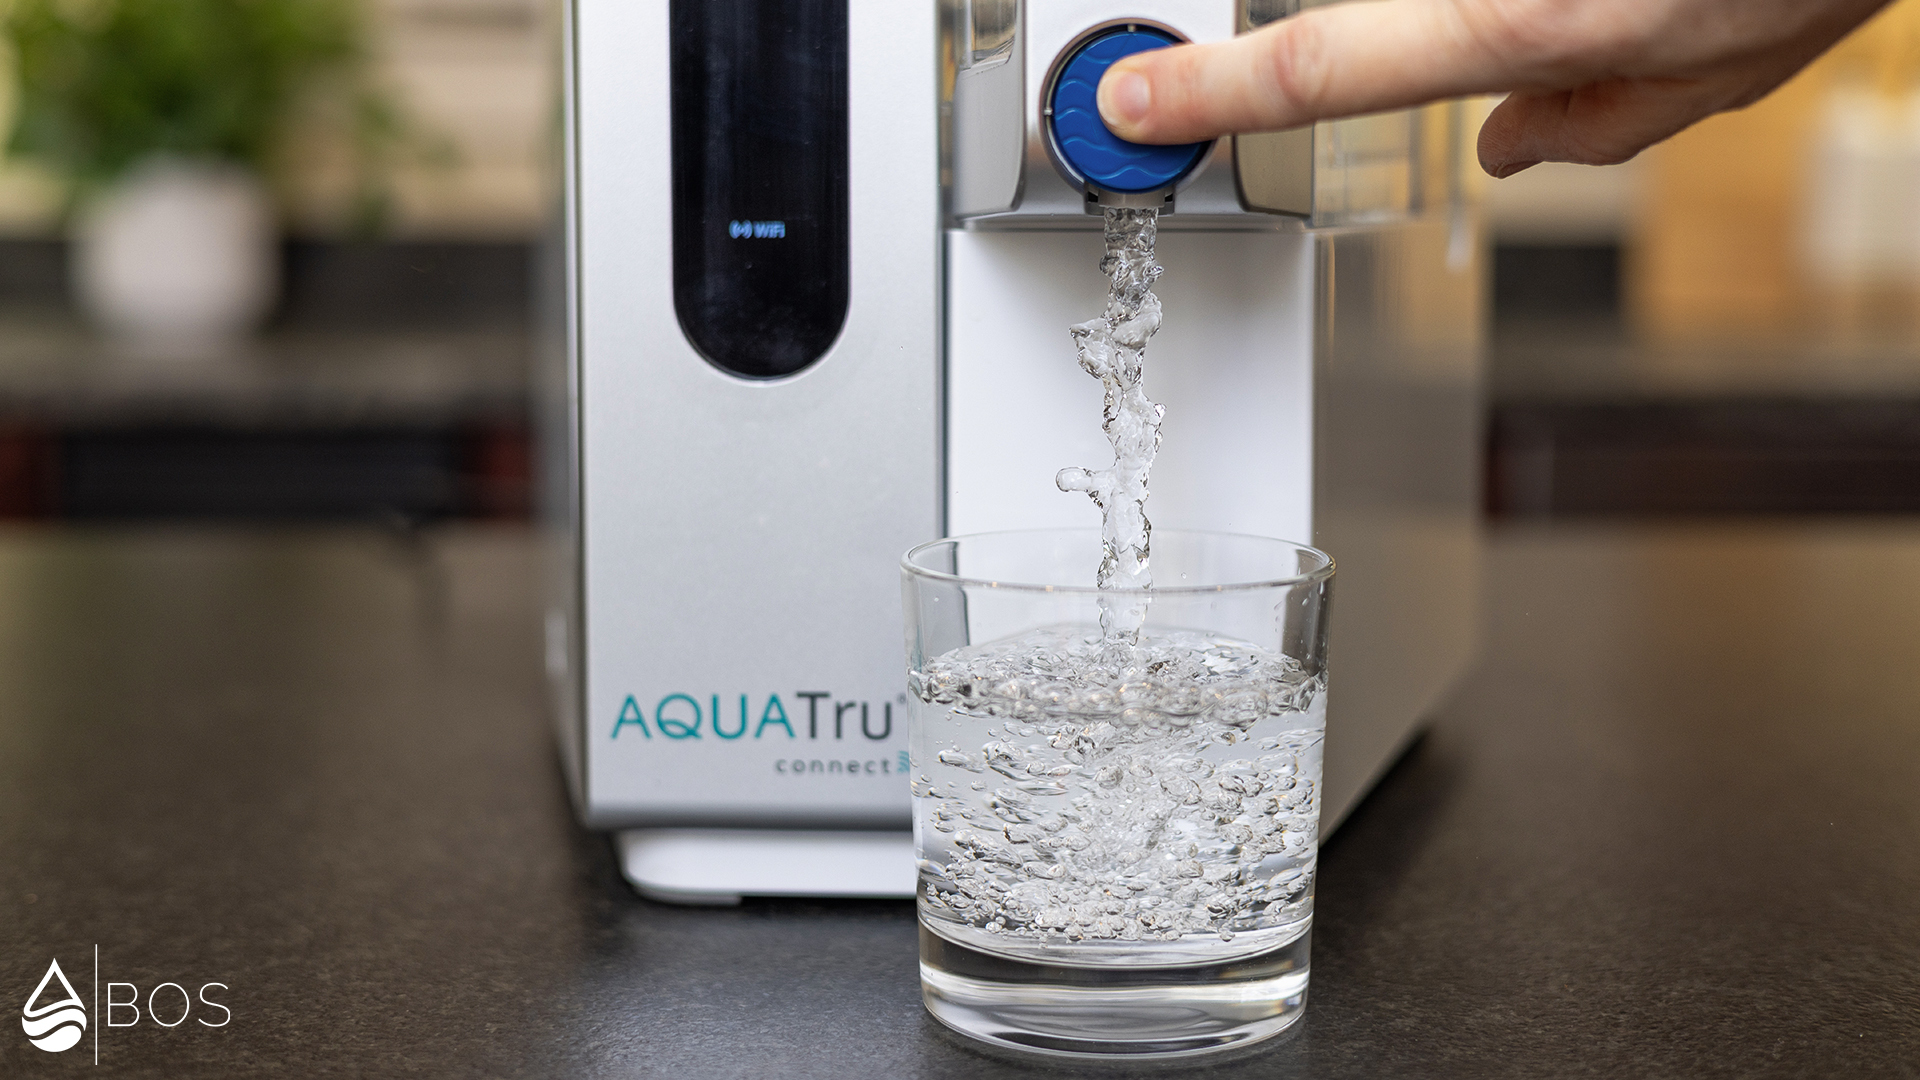
- Dispensing: splashing, slow ramp downs from pouring, touchscreen responsiveness/intuitiveness, volume presets or custom options, and ease of carafe handling (if applicable) are all assessed.
- Refilling/Size: ease of refilling (including lifting, carrying, and emptying the feed tank), presence of a water change indicator and footprint (in sq. in.) are determined.
- Other (as applicable): fridge storage for portable carafes/clean tanks, app features and navigability, noisiness, TDS monitoring, etc.
- Filter replacements: We evaluate ease of filter changes and the presence of filter change indicators.
- Additional:
- Assess build quality, durability, and offer additional insights on design and materials used.
- Hot/Cold water – For relevant systems, the actual hot/cold water temperature(s) & dispensed volumes are examined and speed tests are run. Volume/temp. presets are noted.
- Wastewater test – We measure how much wastewater is produced per 1 gallon purified. This is also known as the pure-to-drain ratio (more details below).
- We vet out any unique or optional functions including different settings (e.g., “Favorite Mode,” “Night Mode”), auto and manual flushing, child safety locks, UV light, remineralization filters, etc.
- Included items – We check the package for any additional components such as a filter replacement tool, fruit infuser, anti-algae cover, etc.
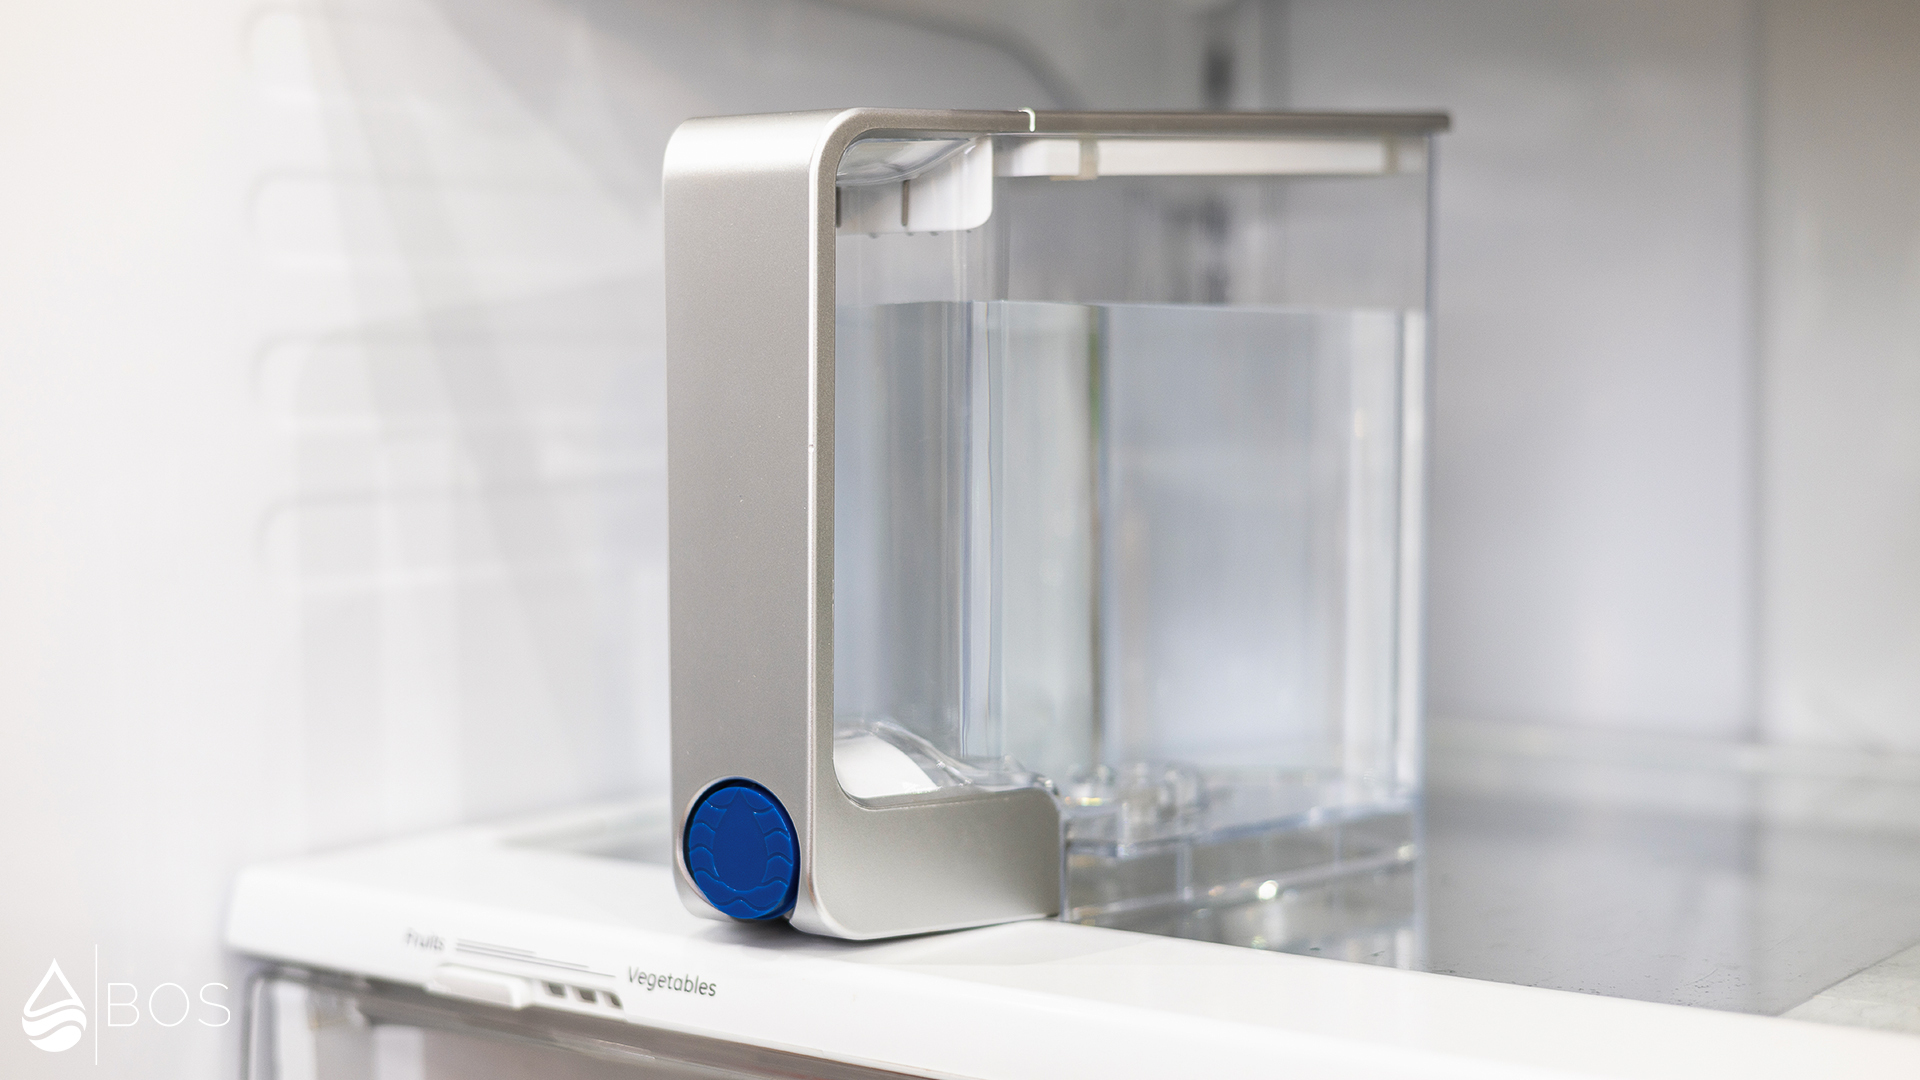
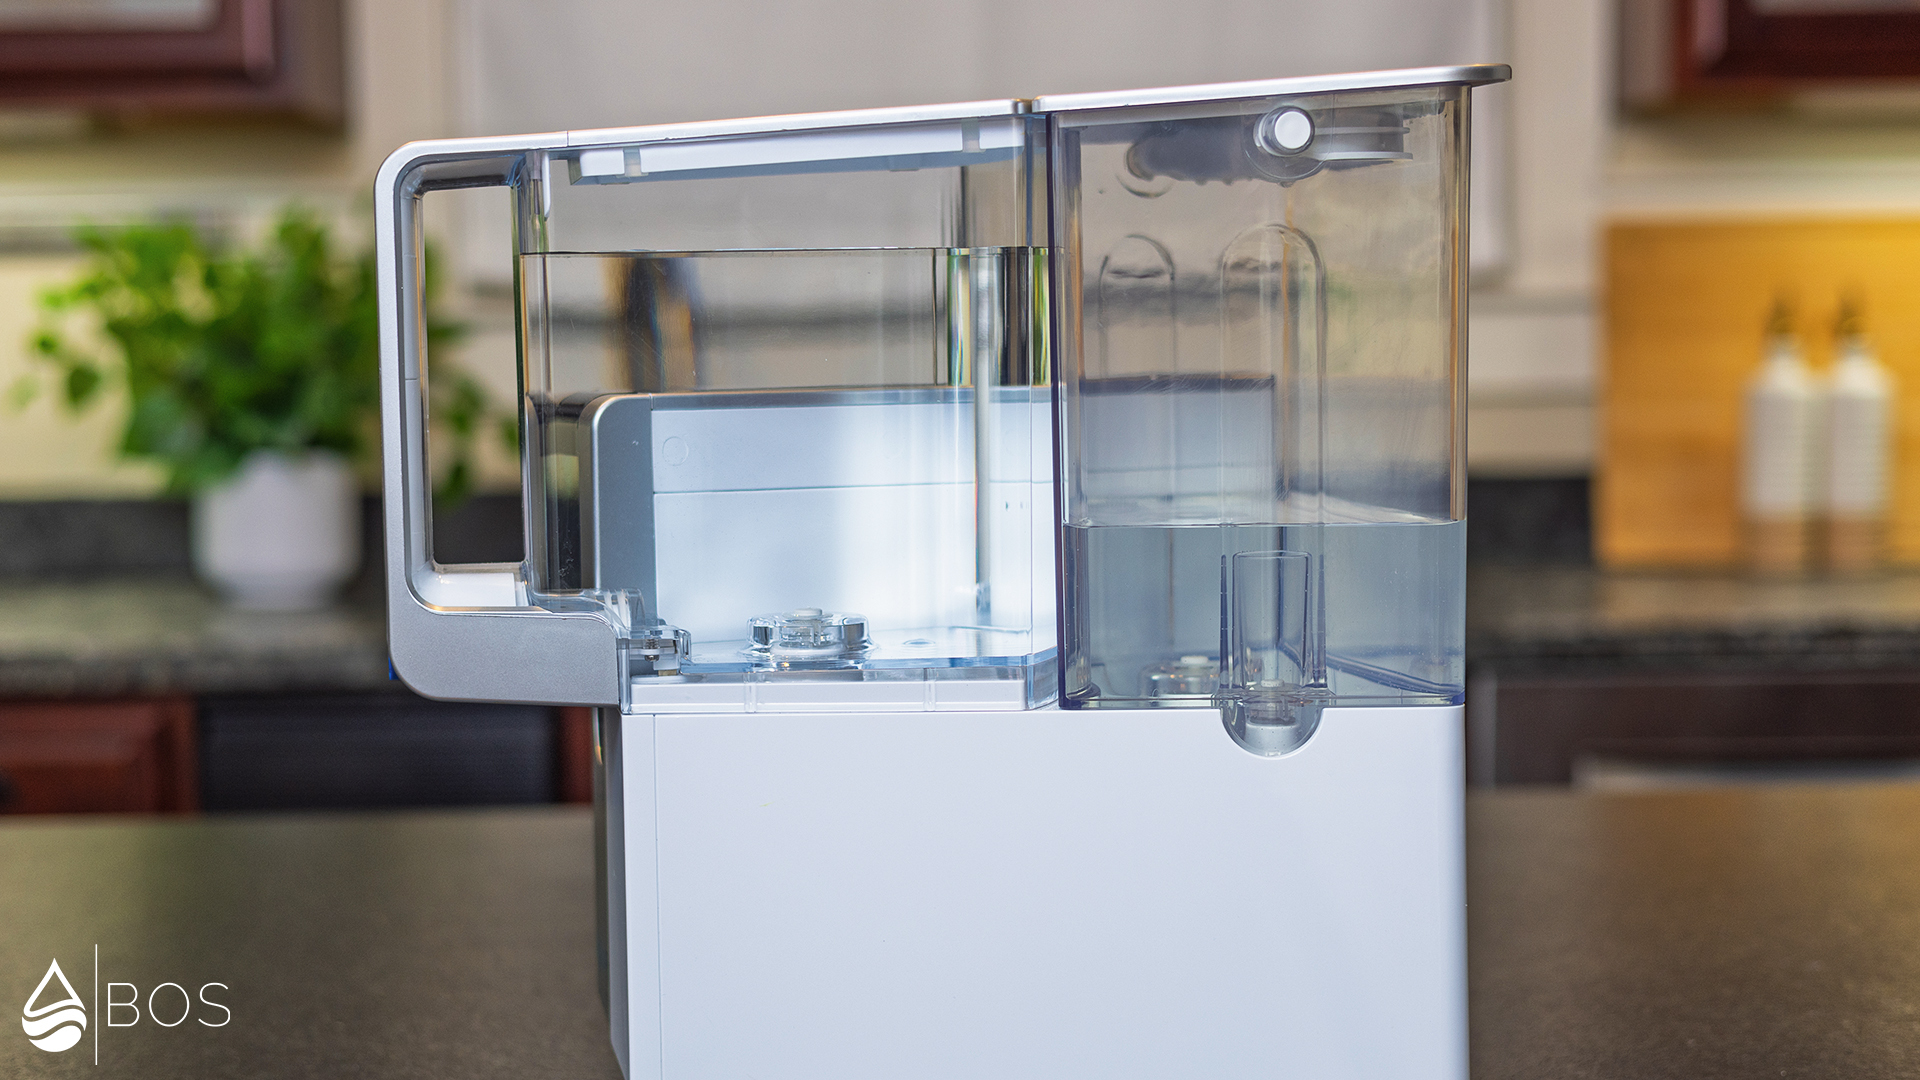
Lab Testing
The purpose of our lab testing is to compare the level of impurities in our tap water before and after treatment. This testing shows us exactly how effective each filter is at removing contaminants under real-life conditions.
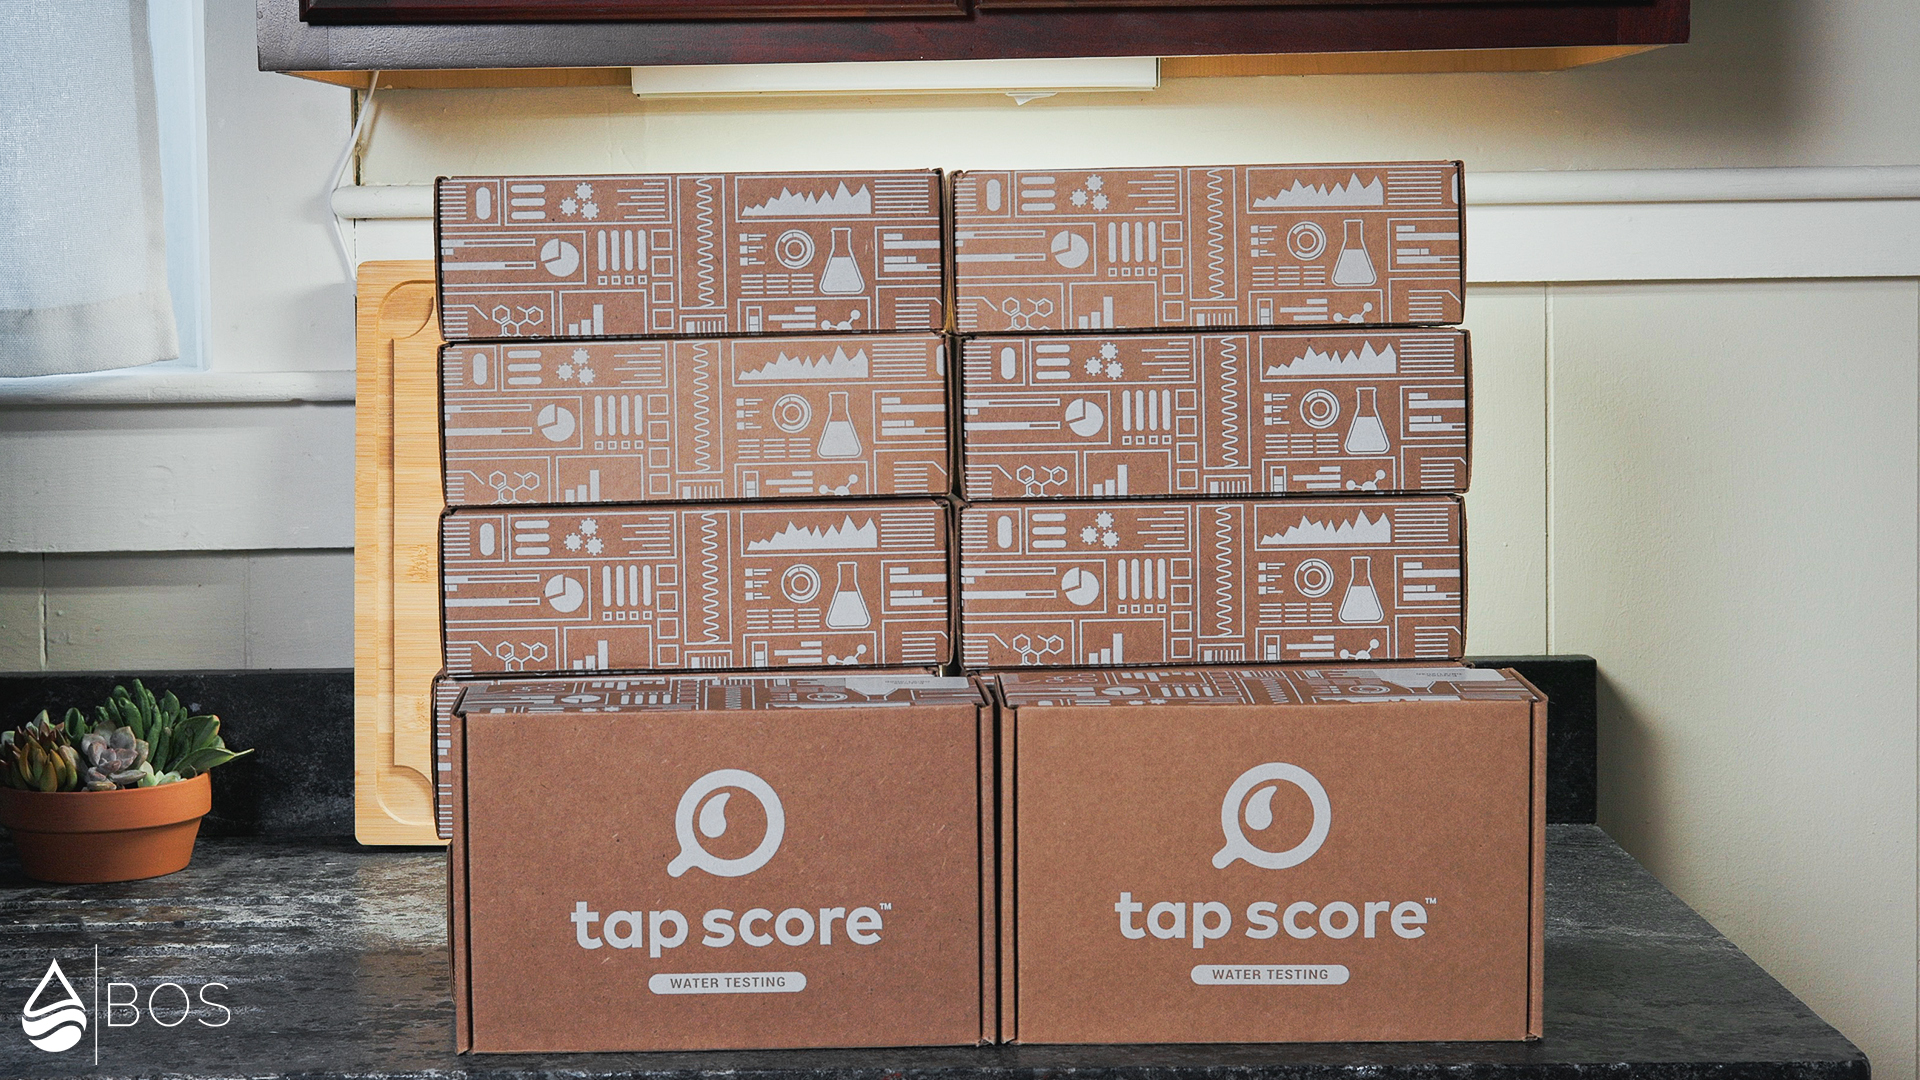
We currently use two trusted, independent lab testing services: ETR Labs (Environmental Testing and Research Laboratories, Inc.) with their Premium Water Test and Tap Score’s Advanced City Water Test. Both services evaluate more than 100 different water analytes and parameters, including:
- Chlorine
- General water quality indicators (e.g., pH, alkalinity, total dissolved solids, hardness, turbidity)
- Metals (e.g., lead, iron, chromium, aluminum, arsenic, uranium)
- Minerals (e.g., calcium, zinc, magnesium)
- Anions (e.g., fluoride, nitrate, nitrite)
- Radon (not part of the Advanced City Water Test)
- Potentially harmful organic compounds (e.g., benzene and other industrial solvents; chloroform and other disinfection byproducts; pesticides; dichlorodifluoromethane and other VOCs)
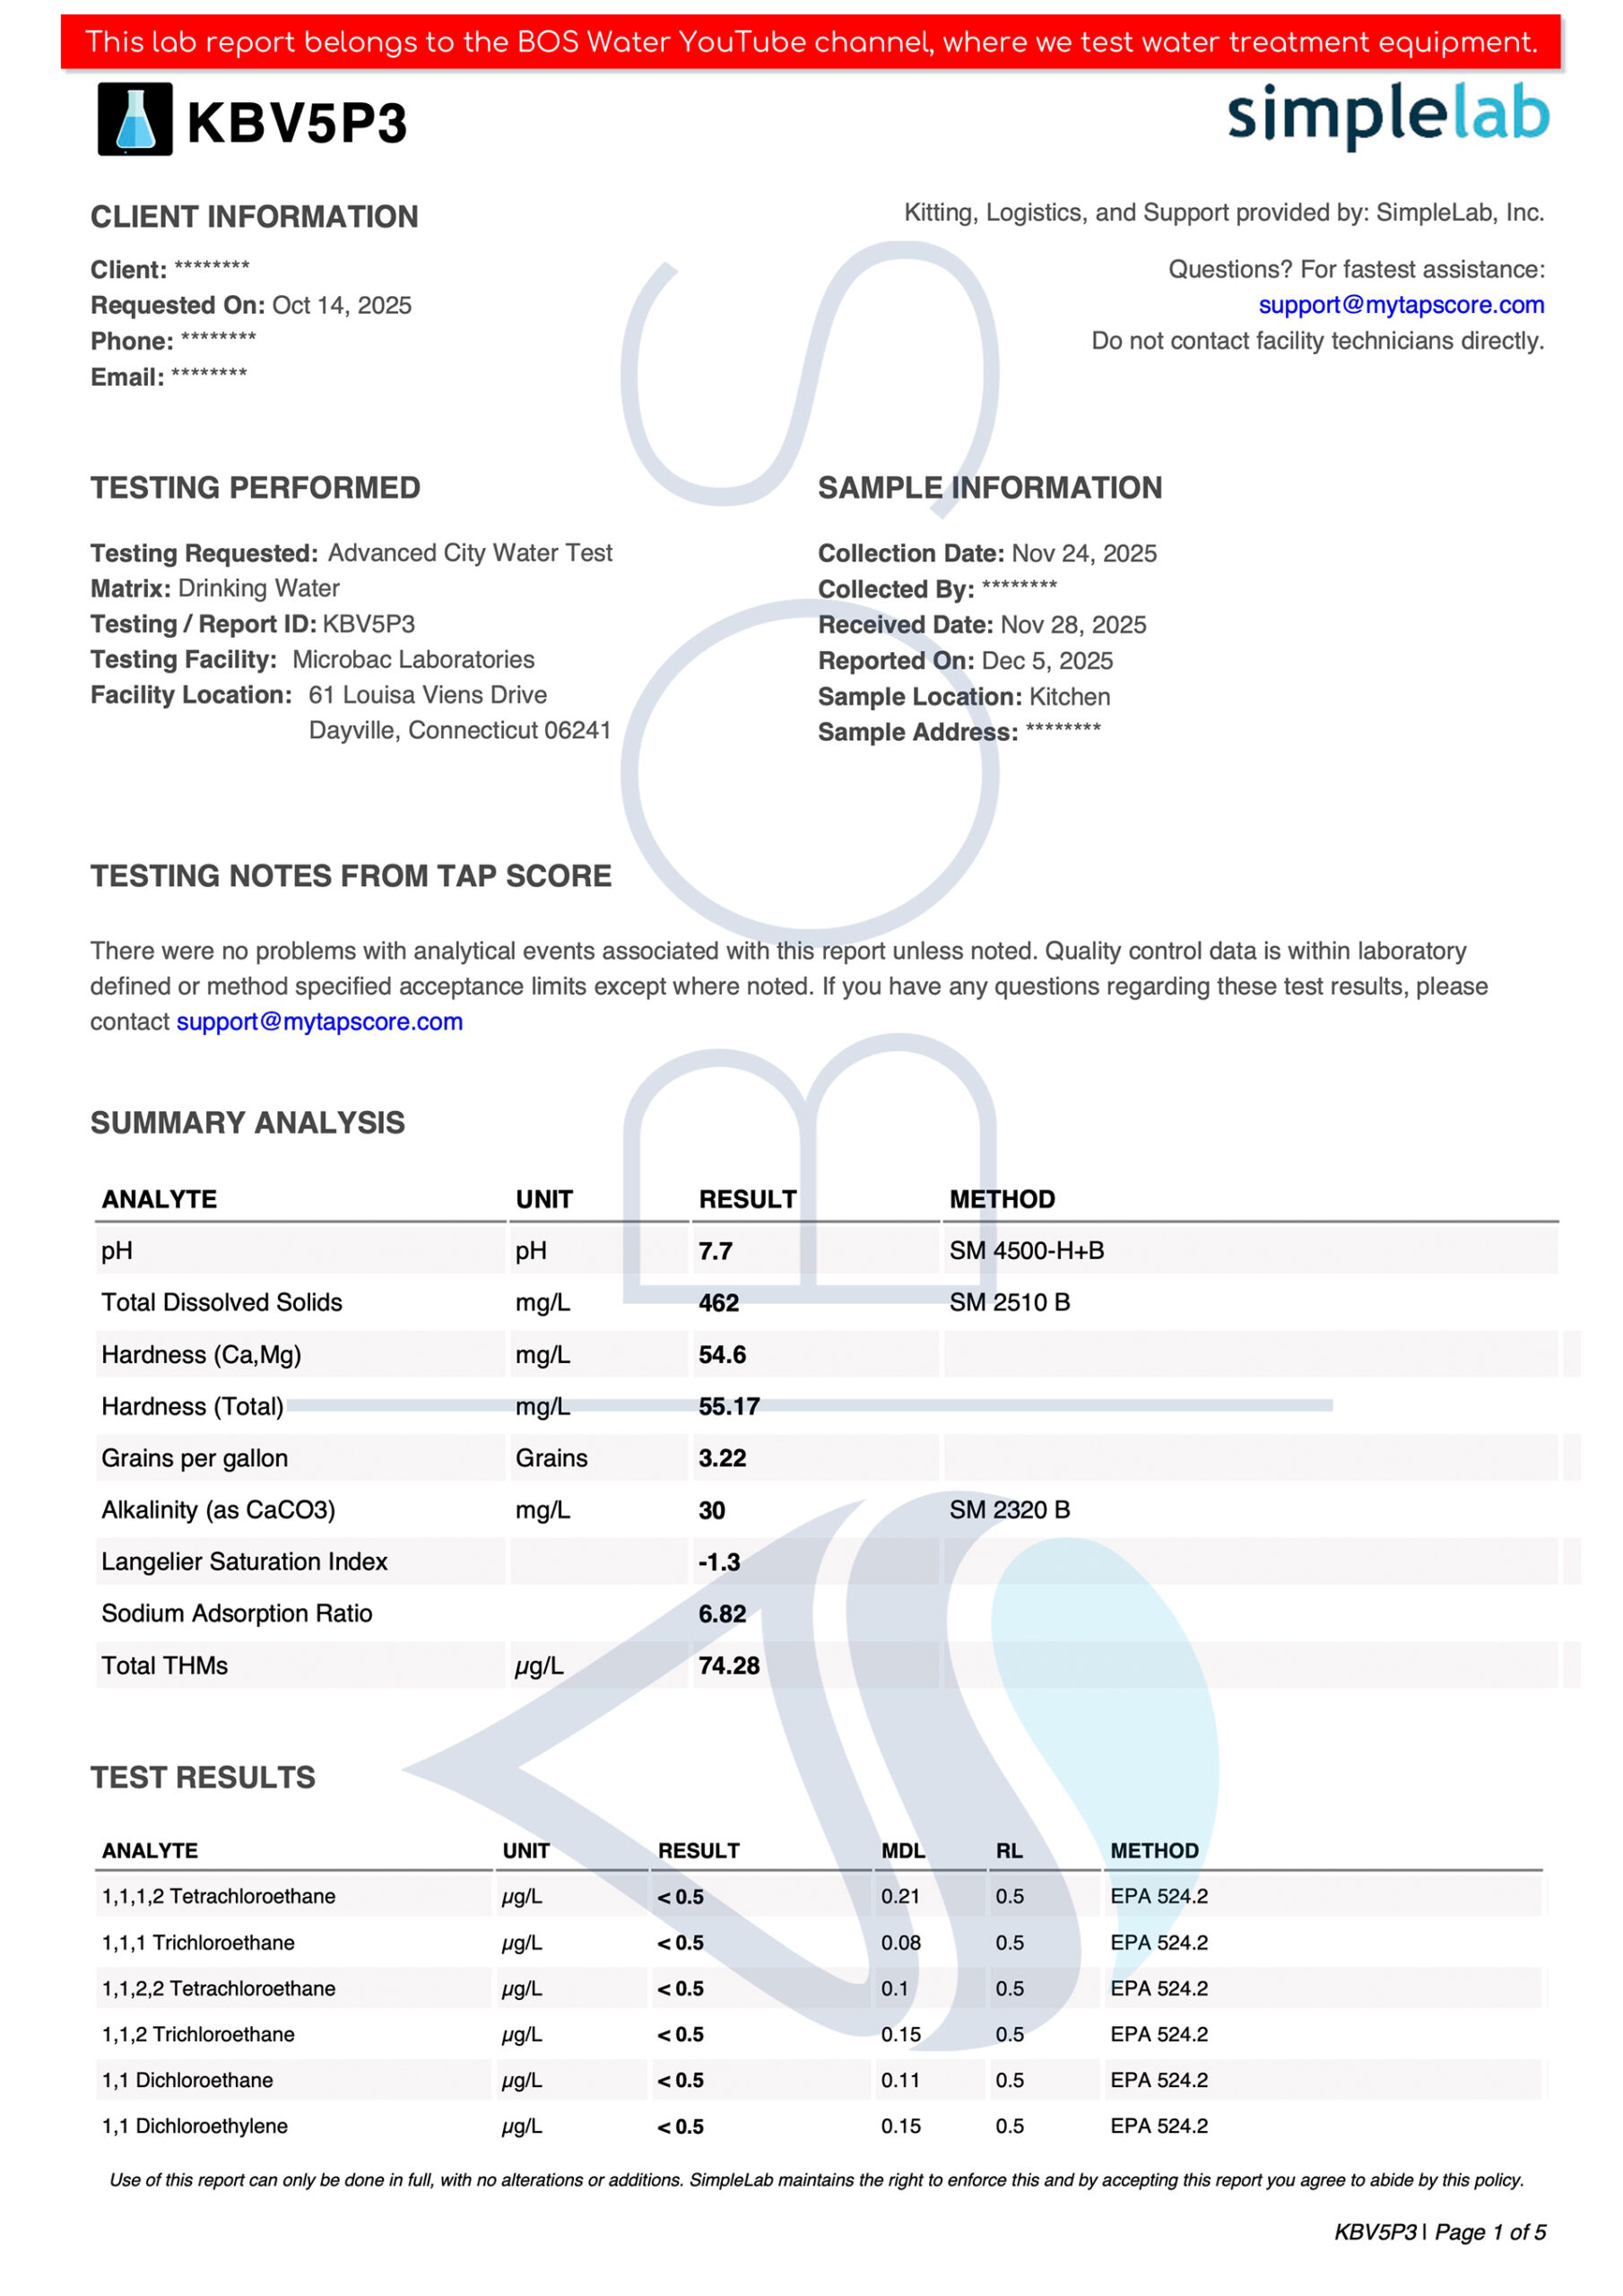
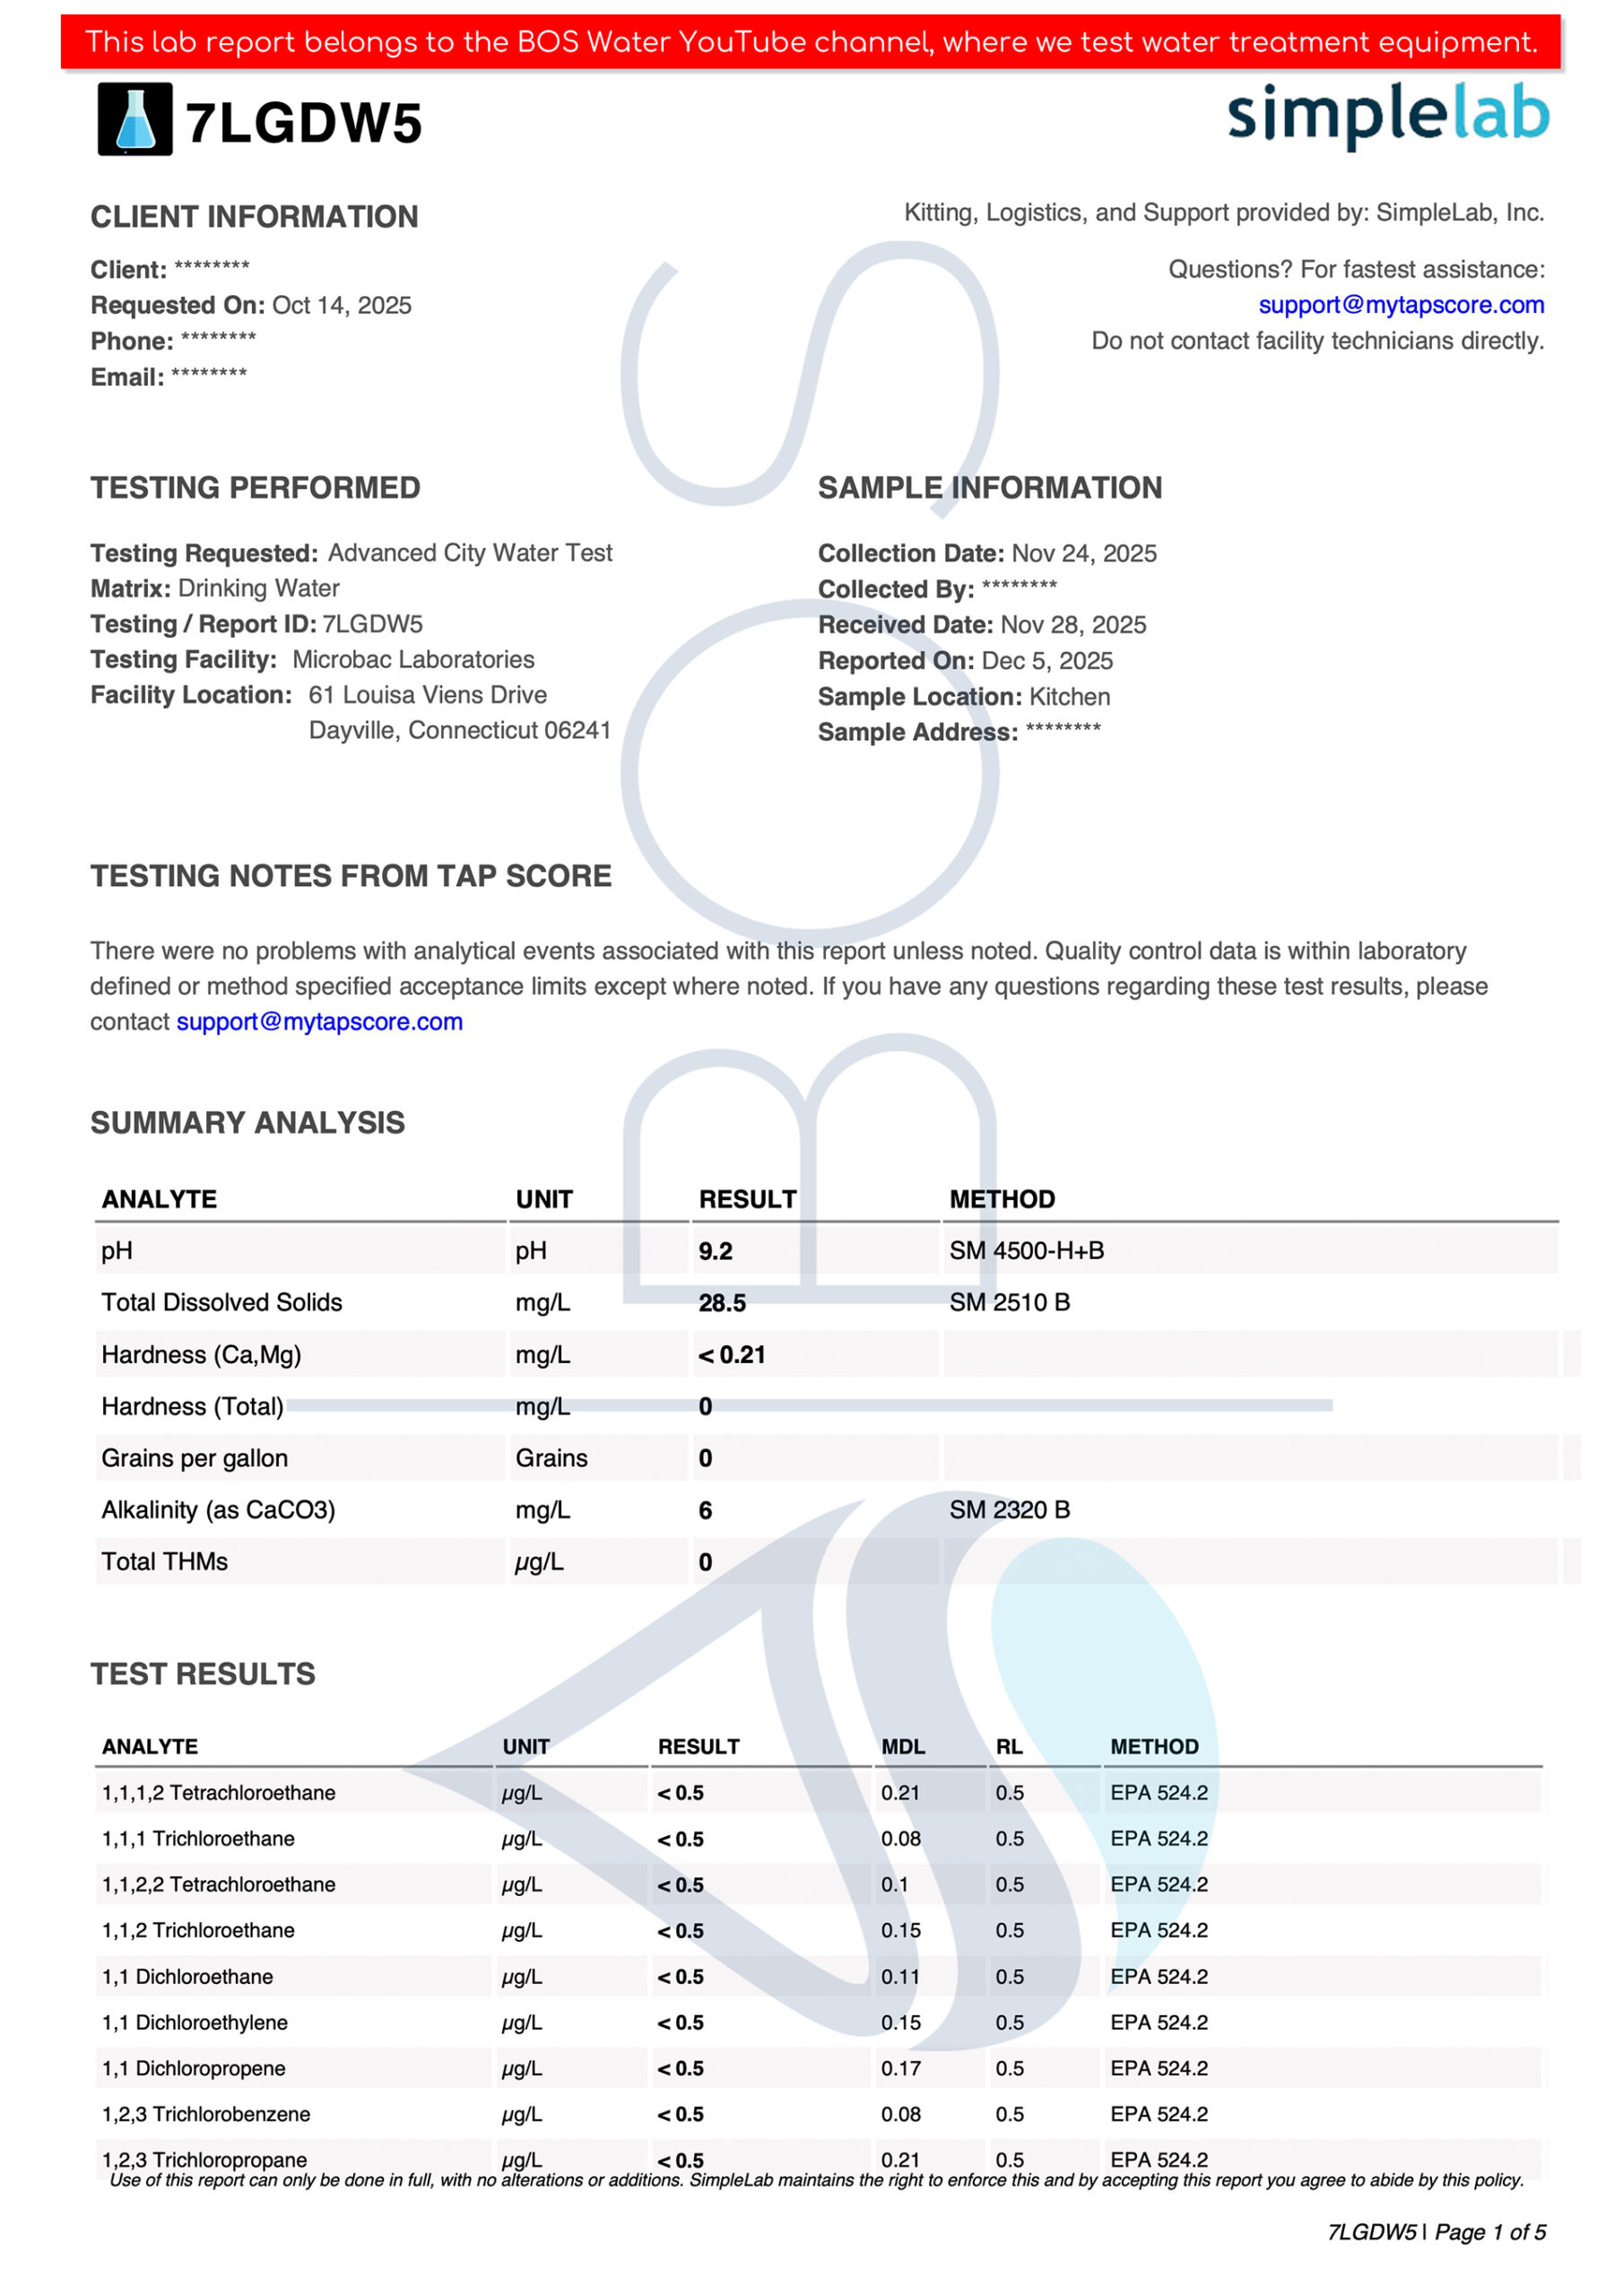
We bear the full cost of all lab testing ourselves, and testing is always performed by an independent lab as noted above. This ensures complete objectivity, as neither our team nor the product’s brand can influence the test outcomes. We also openly publish all lab reports, so you can review the data yourself and draw your own conclusions. Earning your trust through complete transparency is our top priority.
How We Take Samples
We follow a strict protocol taking each water sample:
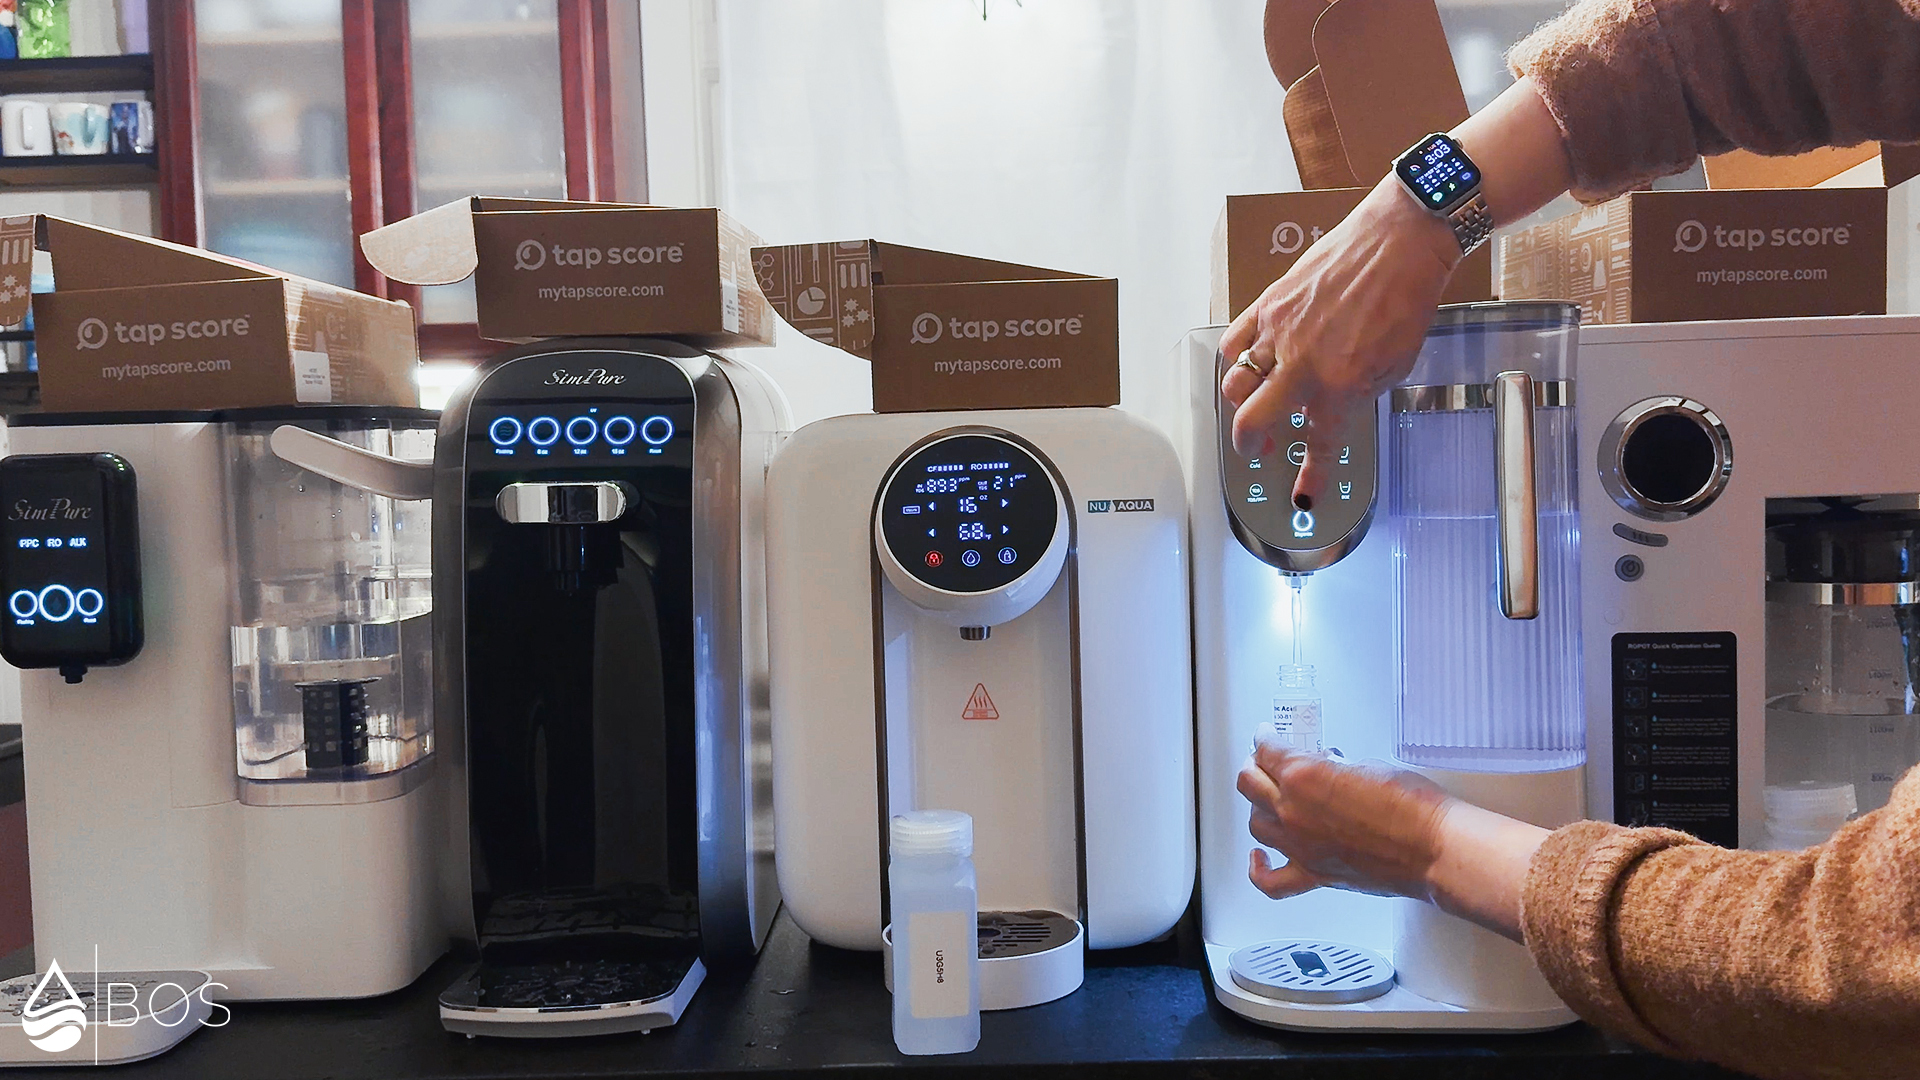
After carefully installing/assembling and priming each system according to its manual, we collect two samples: one from our unfiltered tap water, and another from the filtered water. Samples are always shipped to the testing labs as quickly as possible, usually on the same day.
To ensure consistency, we typically test all products within a single category and test round using the same water source. For instance, in round 1, Sara tested nearly all countertop ROs on her home water supply in San Antonio, Texas. In round 2, she (re-)tested all systems on her new water supply in Massachusetts.
Batched Sampling
When testing multiple products of the same type, we usually sample in batches whenever possible. This approach allows us to take just one unfiltered water sample instead of several, significantly reducing costs, as each test kit costs around $240-300.
For example, in our second test round, we sampled the following countertop RO systems in the same batch:
- Batch 1: AquaTru Classic (Smart), AquaTru Carafe (Smart), Waterdrop C1H, Waterdrop A1, Waterdrop A2
- Batch 2: SimPure Y9A, SimPure Y7P-BW, NU Aqua Countertop RO System, APEC ROCT-C1
- Batch 3: RKIN U1-W, Frizzlife WB99-C, Bluevua RO100ROPOT, Bluevua RO100ROPOT-Lite, Sans Water Purifier
Sampling procedure (countertop ROs round 2):
- Each system was properly set up, primed, and emptied.
- We simultaneously ran one filtration cycle through each system to avoid TDS creep, discarding the resulting water.
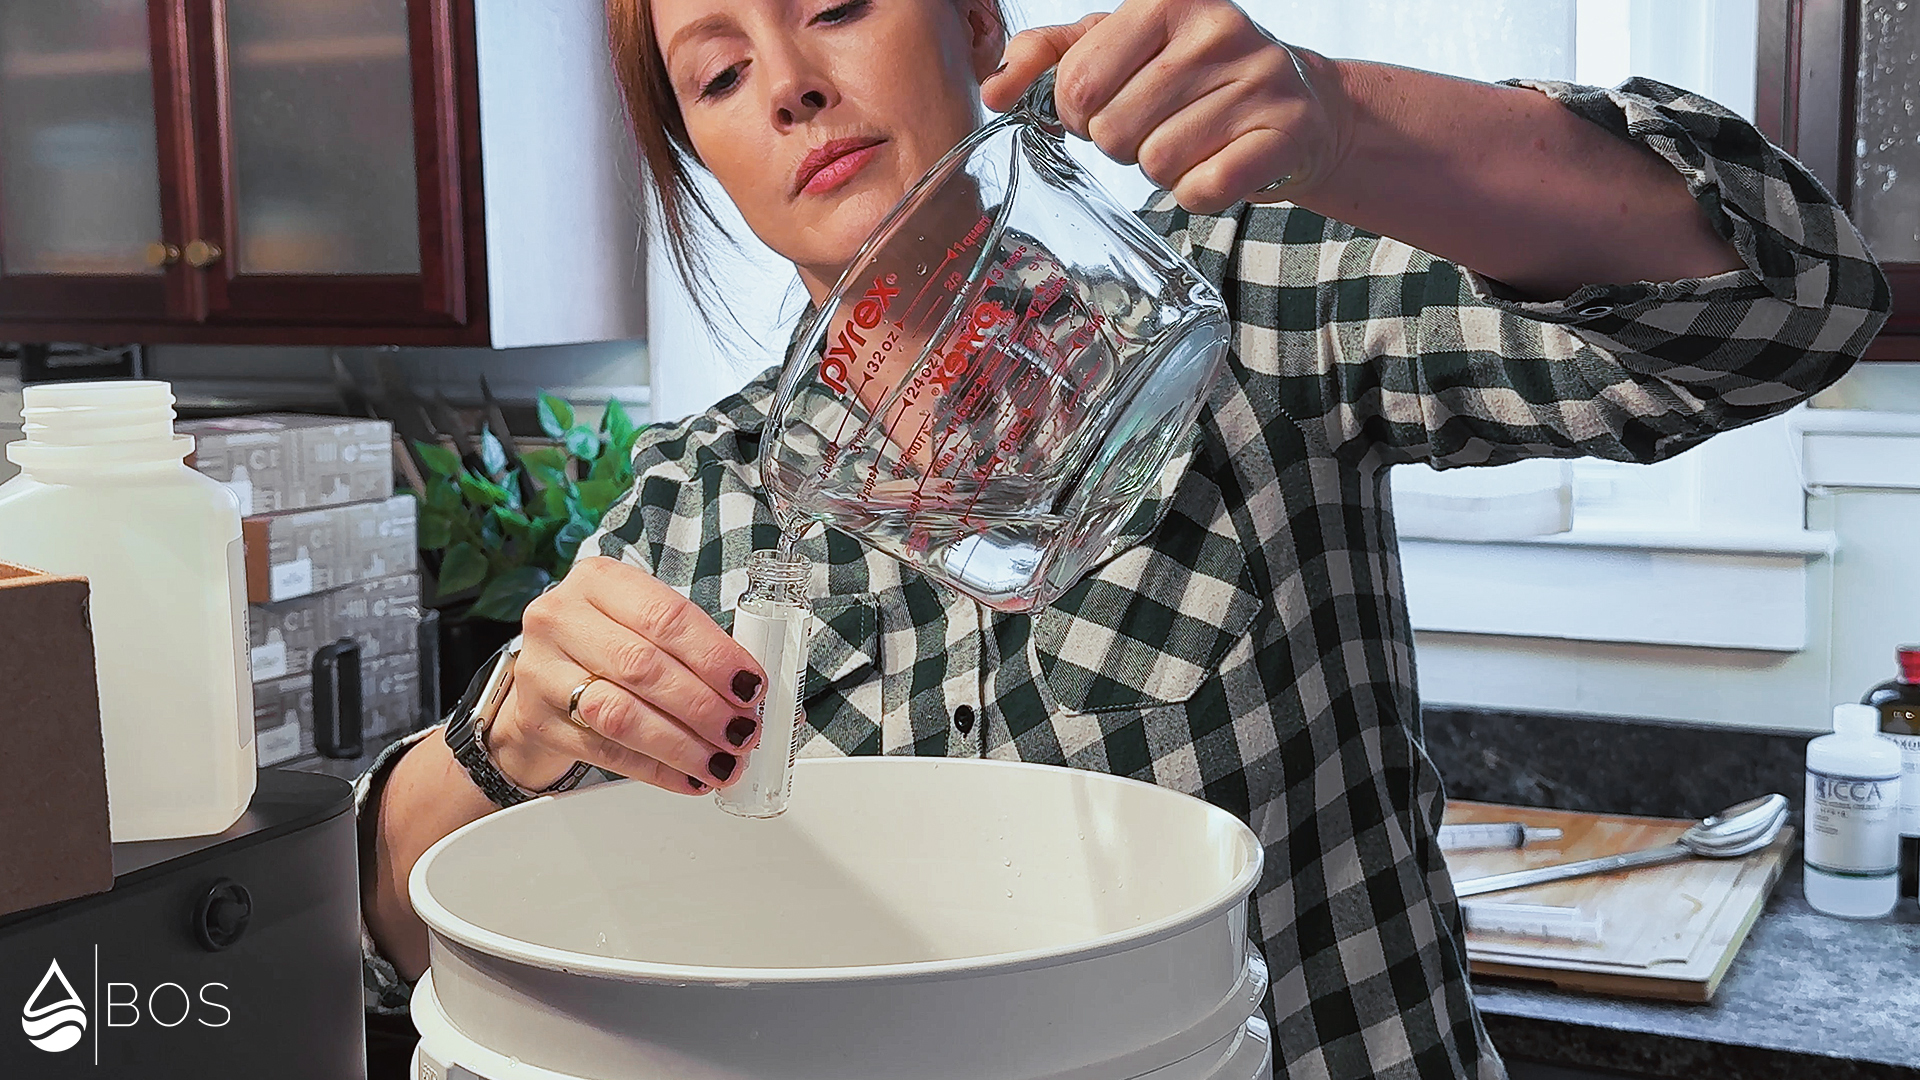
- We filled a large bucket with tap water and added measured amounts of fluoride and nitrate to simulate common contaminant levels, stirring thoroughly to distribute them evenly.
- Using a measuring cup, we poured the same amount of water into each countertop RO system, ensuring there was sufficient water remaining in the bucket to maintain even sediment distribution.
- We allowed the water to fully process through each system, working quickly to minimize volatile contaminant loss.
- For each system, we dispensed and discarded 3 cups of ambient-temperature water before collecting our filtered water sample directly from the system.
- The untreated water sample was collected directly from the leftover water in the bucket.
- All samples were shipped to the lab on the same day.
Evaluating the Lab Reports
Once the lab results are available, we carefully review them to see how the impurity levels and water quality parameters differ between the unfiltered tap water and the filtered water. Where needed, we calculate the percentage reductions or increases. In essence, we ascertain how effectively a countertop RO removes the specific contaminants found in our water supply. Occasionally, lab results reveal new impurities in filtered water that weren’t present in the original tap water, and we highlight those findings as well.
How do we decide which impurities or parameters matter most, and which can be safely ignored? That depends entirely on the type of product we’re reviewing. For example:
- Water filters (including countertop models): Their main purpose is to remove potentially harmful contaminants, so we research and identify these for our analyses. We reference the strictest available public health goals or guidelines, often from sources like OEHHA, EWG, EPA, or WHO. Sometimes, we also check standards set by state health departments or even international guidelines from countries like Canada. On the other hand, some impurities aren’t harmful but can still cause aesthetic issues – like impacting water taste/odor – above a certain threshold, so we consider these as well.
- Water softeners: The primary goal is reducing water hardness, so we focus on calcium and magnesium levels.
Calculating the Lab Score
Finally, we use our custom-made, in-house tool to calculate the lab scores. Continuing with our countertop RO example, each product starts out with a perfect 5.00/5.00. In other words, we begin with the expectation that a system will perform optimally, fully removing all undesirable impurities and not adding any new ones to our filtered water. Then, based on strict criteria, points are deducted for the following (this list reflects the core principles but isn’t fully exhaustive, as there are additional nuances and outliers we won’t detail here):
- Contaminants that are not fully removed lose points.
- Points are subtracted based on both the degree of removal and the total number of incompletely removed contaminants.
- For example, a system that only removed 57% of strontium will lose more points than a system that removed 96% of strontium.
- Likewise, a system that completely removed only 5 out of 12 contaminants will generally lose more points than a system that completely removed 10 out of 12 contaminants.
- Contaminants that were present in the tap water and significantly increased in the filtered water lose additional points (a significant increase is required to rule out natural fluctuations).
- Potential leaching (where new impurities that were not present in the tap water appeared in the filtered water) loses points.
- This is further subdivided into “harmful leaching” and “less serious leaching.” Substances with serious, proven adverse health effects – such as arsenic – lose more points than substances like trace minerals (e.g., copper). Copper, for example, can still cause health problems if consumed in excess, but it is a necessary dietary element that is needed for normal physiology. Therefore, we would only deduct points if copper exceeded its recommended public health goal of 0.3 ppm.
- Additionally, more points are subtracted for greater amounts of potential leaching. Specifically, deductions are made in proportion to how much may have leached in relation to the strictest health guideline we could find. If aluminum, for instance, appeared in the filtered water at 1.00 ppm, it would lose more points than if it appeared in the filtered water at 0.01 ppm.
- Therefore, both the extent of the potential leaching and the degree of potential harm caused by the substances in question are carefully taken into consideration.
- Points are not deducted for potential leaching of “aesthetic contaminants” such as zinc or iron, unless they exceed the limits (SMCLs) defined in the EPA’s secondary standards. These chemicals do not pose a health risk when present below the SMCLs, though they may adversely affect the taste and odor of the water.
- For ROs, points are subtracted if TDS removal is too low. By design, ROs should be extremely effective at reducing TDS, and high TDS reduction is an indicator that the RO membrane is working as intended. One exception is when the RO system uses remineralization, which naturally increases TDS levels post-filtration.
These various criteria are input into our proprietary Lab Results Calculator to obtain the Lab Results Score reported in the comparison sheet. This Lab Results Score contributes most heavily to the overall Filtration Score mentioned previously.
Let’s walk through an example.
The AquaTru Classic received Lab Results Scores of 4.97/5.00 (2024) and 5.00/5.00 (2025), based on the following:
In 2024, 11 out of 13 contaminants were fully removed. The substances that remained in the filtered water included strontium (96% removed) and fluoride (anywhere between 41% and 99% removed). Small deductions were made to account for these two contaminants that were not completely removed from the tap water. TDS was high at 91%, so no points were lost here. A small amount of aluminum was detected in the filtered water (but well below the strictest health guideline we could find), so additional points were lost for potential leaching. There were no substances in the tap water that increased post-filtration.
In 2025, all 12 out of 12 contaminants were fully removed from the tap water. Plus, there were no increases of impurities post-filtration, nor any evidence of potential leaching. TDS removal stayed high at 94%. No points needed to be subtracted in this test round per our scoring criteria listed above. With its flawless filtration performance, the AquaTru Classic scored a perfect 5.00/5.00 in 2025.
Taste & Odor Test
We assess freshly filtered water and categorize the results into one of several ratings. This Taste/Odor Score is added to or subtracted from the Lab Results Score and therefore also contributes to the Filtration Score.
| Taste/Odor Result | Score |
|---|---|
| Pleasant mineral taste, free of any odors (remineralization systems only) | 0 |
| Clean taste and odor | 0 |
| Taste and odor improved considerably – but not 100% perfect | -0.10 |
| Taste/odor improved only slightly | -0.25 |
| No taste/odor improvement | -0.50 |
| Taste/odor improved in one way but worsened in another | -0.50 |
| Taste and odor worsened | -1.00 |
Usability Testing
When testing usability, we mimic normal everyday use to get plenty of hands-on experience.
First, we set up each product exactly as described in the instructions, carefully noting any issues or standout features. After the initial setup (which, for countertop filters, involves filter priming), we use and maintain each system just like a typical consumer would – including replacing filters.
In addition, we run several standardized tests, and each system receives or loses points depending on its performance. Some tests are meant to evaluate whether the system is practical for the average US or US family households, which range from ~2.55-3.15 people according to the US Census Bureau.
To keep things consistent, testing for each product category is always carried out by the same team member. This way, we ensure our results stay as accurate and comparable as possible.
Speed Tests: A Closer Look
Depending on the type of water filter, we measure dispensing speed, filtration speed, or a combination of both – whichever provides the most useful, actionable information.
To continue our example with ambient water countertop ROs, there are three main speed tests we perform:
- Dispensing 1 Cup after Pre-Processing: We fill the feed tank and allow the system to fully (pre-)process all the water. This may take several minutes (up to 12-15) depending on the device. After the water is done filtering, we measure the time to dispense 1 cup of water.
- Dispensing 4 Cups of Ambient Water after Pre-Processing: The same steps are performed as above, except the time to dispense 4 cups is measured.
- Dispensing 4 Cups of Ambient Water upon Feed Tank Refill: We measure the time it takes to process and dispense 4 cups of water. We start the clock after filling the feed tank in an otherwise empty system.
Some countertop ROs filter water on demand, while others pre-filter and store water for immediate dispensing.
Wastewater Test
For countertop reverse osmosis systems (and any other type of RO), we measure wastewater output. Specifically, we test how much purified water each system produces compared to how much water it wastes.
Exact testing procedure for countertop ROs:
- We empty all water tanks.
- We fill the feed water tank to the max line, carefully measuring the exact amount added.
- We dispense as much filtered water as possible and until the flow stops and/or the system prompts a refill. For systems offering various temperature settings, we dispense all available cold, ambient, and hot water.
- We measure the volumes of purified water and wastewater separately.
- We calculate the final pure-to-drain ratio.
Using the AquaTru Classic example, we calculated a pure-to-drain ratio of ~1:0.6 (2024) and ~1:0.61 (2025).
Wastewater indirectly impacts a system’s Usability Score and thus Final Rating, as it affects the number of times the feed tank needs to be emptied and refilled (higher wastewater results in more daily refills).
Usability Scoring
Below is an abridged version of our Usability Score rubric for ambient-only countertop RO systems, intended to give an overview of our testing criteria. Not shown (for brevity) is the detailed point breakdown for each of the scored criteria examples. The maximum total points (right-hand column) indicate the relative weight assigned to each of these usability sub-categories.
Countertop ROs which also provide hot and/or cold water have a slightly modified rubric to account for hot/cold water temperature(s), dispensing speed, and hot/cold water volume, amongst other factors.
Countertop RO (Ambient Water) – Usability Score Rubric
| Category | Examples of Scored Criteria | Max. Points |
|---|---|---|
| Setup Process Incl. Filter Priming | -Setup process is easy and straightforward vs. setup issue(s) noted. -Instructions are illustrated & clear vs. could be more detailed. |
0.80 |
| Everyday Use (Speed & Water Capacity) | -System is suited for daily use (i.e., can it meet the typical daily water demands of average US households)? -Number of daily refills required? -Stores water in an external clean tank or carafe for instant access later? -Speed test results. -Max. continuous dispensing test (can you fill a 40-oz bottle or 2-quart carafe at one time from a single feed tank refill)? |
1.40 |
| Everyday Use (Dispensing) | -Display/buttons are easy to use/navigate? -System ramps down from pouring (no instant stop)? -Custom dispensing amounts possible (incrementally adjustable)? -Splashes? -Carafe (if present) pours/handles well? -Volume presets available? |
1.00 |
| Everyday Use (Refilling & Size) | -Easy to refill vs. feed tank harder to lift or access. -Water shortage/change reminder (can also be in-app)? -Space-saving vs. larger footprint. -Simple design: empty wastewater and refill after each filtration cycle? |
0.70 |
| Everyday Use (Other) | -Noisy when filtering/dispensing? -TDS monitoring option? -Useful app (tracks more than just TDS and filter life)? -Dispensing light? -Portable clean tank or carafe? |
0.60 |
| Subtotal (Everyday Use) | 3.70 | |
| Filter Replacements | -Easy to replace vs. issues encountered? -Has a filter life indicator? -In-app: filter change reminders + filter ordering? -Color-coded filters for easy install? |
0.50 |
| Total (Usability) | 5.00 |
Using the AquaTru Classic as our running example, it scored full points (0.80/0.80) for Initial Setup, as the process (including filter priming) was very easy and straightforward. Everyday Use (2.94/3.70), broken down into Speed and Water Capacity (1.14/1.40), Dispensing (0.90/1.00), Refilling & Size (0.70/0.70), and Other (0.20/0.60), also received high marks based on its speed test results, large, removable external clean tank, splash-free dispensing, ease of refilling, and intuitive design and user interface. Finally, it received 0.50/0.50 for its simple filter changes. Therefore, this brings the Everyday Use Subtotal and overall Usability Score to:
Step 4: Rating and Ranking
Finally, it’s time to rate and rank the products we’ve tested. For water filters, including countertop ROs, we score and rank products across the three main categories discussed in detail throughout the Editorial Guidelines. Each category is scored from 0.00 to 5.00, with 5.00 being the highest:
- Filtration – We start with the calculated Lab Score(s) and then adjust by adding or subtracting points based on the Taste & Odor Test Score(s) and the NSF Score (based on NSF/ANSI certifications & additional third-party test data). With the exception of the taste/odor tests, the Filtration Score is a highly objective rating reflecting the most critical function of a water filter: contaminant removal. Therefore, the Filtration Score is given the most weight in our Final Score (60%).
- Usability – This score combines some of the more subjective or qualitative system features in addition to our highly standardized, quantitative measurements, like speed test results and water capacity. The Usability Score accounts for 20% of the Final Score.
- Costs – We use an in-house algorithm to assess each product’s value relative to the average cost of comparable products (for example, countertop RO systems with hot water functionality). We take both upfront and long-term (i.e., filter replacement) costs into consideration. During this calculation, we adjust the upfront price of a product if a company has provided us with a discount code. However, if getting a discount requires some kind of subscription, then this doesn’t count in our evaluation. Finally, points are given or deducted for any extra features – good or bad – that we feel add or detract from the overall value, such as premium build quality/materials or an additional UV stage. The Cost Score makes up the remaining 20% of the Final Score.
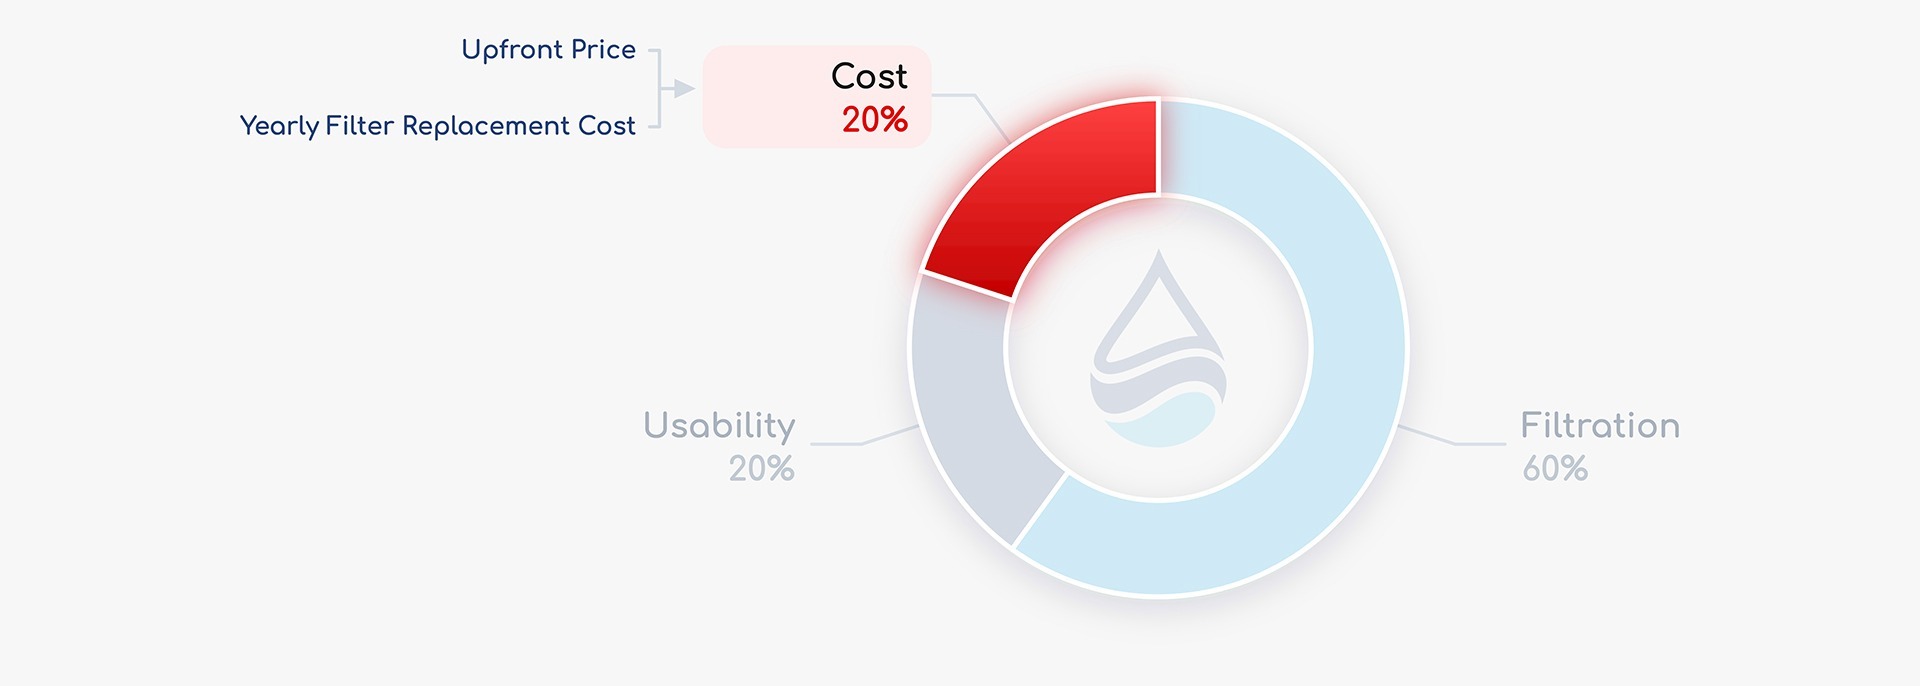
To summarize, to obtain our Final Rating (Score), we apply the following weighting to each of the three scored categories:
- Filtration: 60%
- Usability: 20%
- Costs: 20%
For the AquaTru Classic, the formula looks like this:
As a result, it achieved a Final Rating of 4.76 out of 5.00.
How We Earn Money (and Keep BOS Water Free)
We’re committed to keeping our content – especially our product reviews and comparisons – free for everyone, and we’re fully transparent about our business model. Like any other business, we need to generate income to cover our expenses, which include purchasing many of the products and services we test, paying for lab testing, video production, and compensating our team. Beyond covering costs, we also aim to grow and be a profitable business.
Right now, most of our income comes through affiliate programs. We participate in affiliate programs run by brands, sellers, and marketplaces within the home water treatment industry, including major marketplaces like Amazon. That means our website and YouTube channel contain affiliate links. If you choose to buy a product or service through one of these links, we may earn a small commission – at no extra cost to you.
That said, commissions never affect our ratings. Our recommendations are not influenced by the commission rates offered by the brands we review. As outlined above, our reviews follow strict, standardized protocols, and all opinions are entirely our own, based on independent, unbiased evaluations. We also never accept payment in exchange for positive reviews.
We fully understand that earning money through affiliate links can raise questions about trust. That’s why we go a step further by openly publishing all our findings – including full lab reports – so you can review the raw data yourself and make your own informed decisions.